The Definitive Guide to Linux Process Injection
Introduction
Process injection techniques are an important part of an attacker's toolset. They can enable threat actors to run malicious code inside a legitimate process to avoid detection, or to place hooks in remote processes to modify their behavior.
The topic of process injection on Windows machines has been extensively researched, and there is relatively good awareness of it. For Linux machines, this is not exactly the case. Although some great resources have been written on the topic, awareness of the different injection techniques on Linux seems to be relatively low — especially when compared with Windows.
We drew inspiration from a Windows process injection overview written by Amit Klein and Itzik Kotler of SafeBreach, and aim to provide a comprehensive documentation of Linux process injection. We will focus on “true process injection” — techniques that target live, running processes. This means we will exclude methods that require modifying the binary on the disk, executing the process with specific environment variables, or abusing the process loading process.
We will describe the OS features that facilitate process injection in Linux, and the different injection primitives they allow. We will cover techniques that have been previously described, and also highlight injection variants that were previously not documented. We will conclude by covering detection and mitigation strategies for the highlighted techniques.
In addition to this blog post, we are releasing a GitHub repository containing a comprehensive set of proof-of-concept (PoC) code for the different injection primitives described in the post. These benign PoCs are meant to help understand what a malicious implementation of the techniques might look like, which can help you build and test detection capabilities. For additional information, please refer to the project README.
Linux injection vs. Windows injection
The number of known injection techniques on Windows machines is huge, and keeps growing — from APC queues and NTFS transactions to atom tables and thread pools. Windows exposes many interfaces that enable attackers to interact with (and inject to) remote processes.
The situation is much different in the realm of Linux. Interaction with remote processes is limited to a small set of system calls, and many features that facilitate injection on Windows machines are nowhere to be found. No APIs exist for allocating memory in a remote process or modifying remote memory protection, and definitely not for creating remote threads.
This difference impacts the structure of the injection attack. In Windows, process injection typically consists of three steps: allocate → write → execute. First, we allocate memory in the remote process that will be used to store our code, then we write our code into this memory, and, finally, we execute it.
With Linux, we lack the ability to perform the first step — allocation. There is no direct way to allocate memory in a remote process. Because of that, the injection flow will be slightly different: overwrite → execute → recover. We overwrite existing memory in the remote process with our payload, execute it, and then recover the previous state of the process to allow it to continue executing normally.
Remote process interaction methods
In Linux, interaction with the memory of remote processes is limited to three main methods: ptrace, procfs, and process_vm_writev. The following sections provide brief descriptions for each of them.
ptrace
ptrace is a system call used to debug remote processes. The initiating process is able to inspect and modify the debugged process memory and registers. Debuggers like GDB are implemented using ptrace to control the debugged process.
ptrace supports different operations, which are specified by a ptrace request code — a few notable examples include PTRACE_ATTACH (which attaches to a process), PTRACE_PEEKTEXT (that reads from the process memory) and PTRACE_GETREGS (which retrieves the process registers). Snippet 1 shows an example use of ptrace.
// Attach to the remote process
ptrace(PTRACE_ATTACH, pid, NULL, NULL);
wait(NULL);
// Get registers state
struct user_regs_struct regs;
ptrace(PTRACE_GETREGS, pid, NULL, ®s);
Snippet 1: Example use of ptrace to retrieve the registers of a remote process
procfs
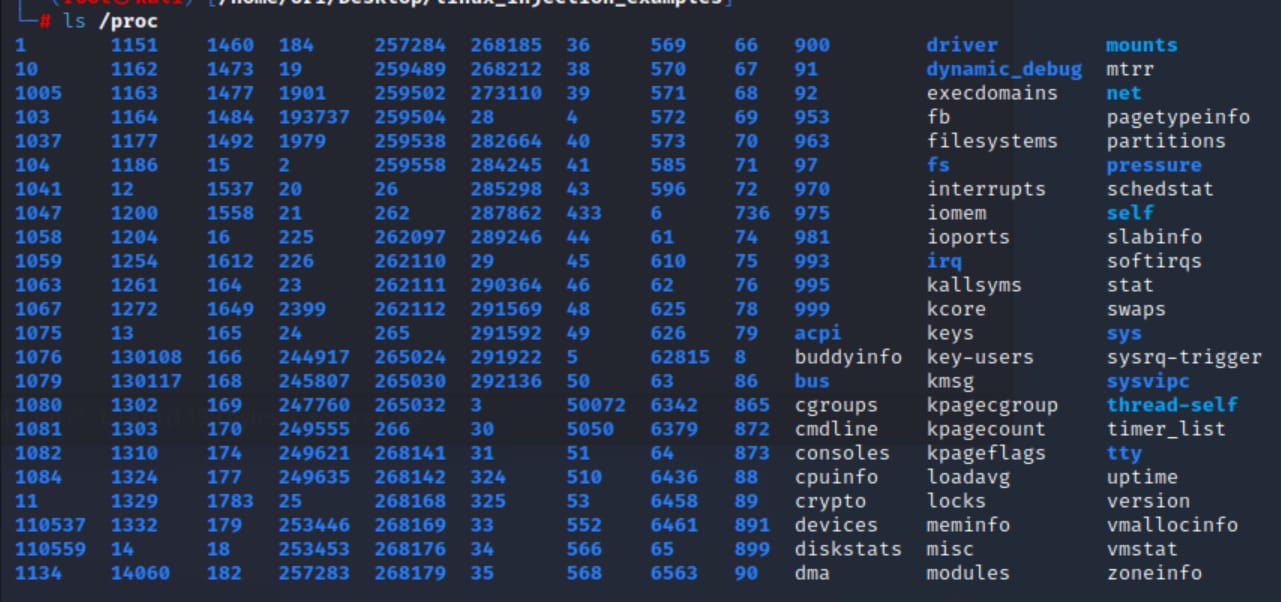
procfs is a special pseudo filesystem that acts as an interface to running processes on the system. It can be accessed through the /proc directory (Figure 1).
Each process is represented as a directory, named according to its PID. Under this directory we can find files that provide information about the process. For example, the cmdline file holds the process command line, the environ file contains the process environment variables, and so forth.
procfs also provides us with the ability to interact with remote process memory. Inside every process directory we will find the mem file, a special file that represents the entire address space of the process. Accessing the mem file of a process at a given offset is equivalent to accessing the process memory at the same address.
In the example in Figure 2, we used the xxd utility to read 100 bytes from the process mem file, starting at a specified offset.
If we inspect the same address in memory using GDB, we will note that the contents are identical (Figure 3).
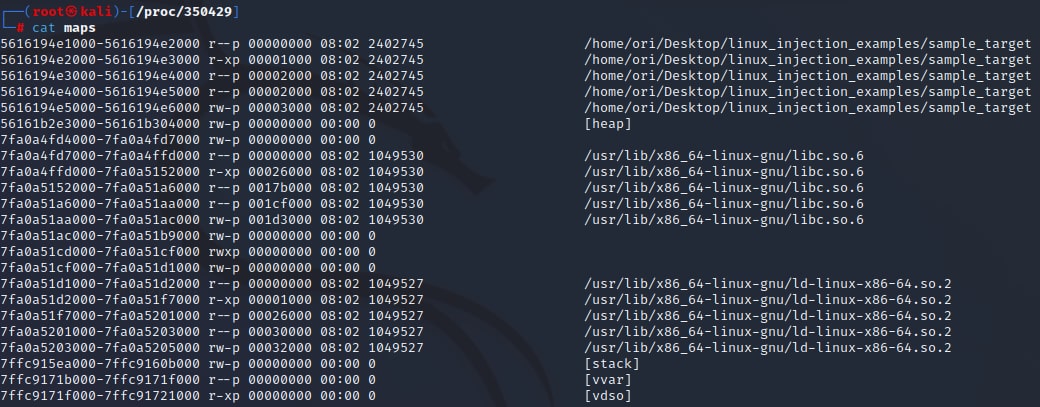
The maps file is another interesting file that can be found in the process directory (Figure 4). This file contains information about the different memory regions in the process address space, including their address ranges and memory permissions.
In the upcoming sections, we will see how the ability to identify memory regions with specific permissions can be very useful.
process_vm_writev
The third method to interact with remote process memory is the process_vm_writev system call. This syscall allows writing data to the address space of a remote process.
process_vm_writev receives a pointer to a local buffer and copies its contents to a specified address inside the remote process. An example of process_vm_writev in use is shown in Snippet 2.
  // Initialize local and remote iovec structs used to perform the syscall
  struct iovec local[1];
  struct iovec remote[1];

  // Place our data in the local iovec
  local[0].iov_base = data;
  local[0].iov_len = data_len;

  // Point the remote iovec to the address in the remote process
  remote[0].iov_base = (void *)remote_address;
  remote[0].iov_len = data_len;

  // Write the local data to the remote address
  process_vm_writev(pid, local, 1, remote, 1, 0);
Snippet 2: Using process_vm_writev to write data to a remote process
Writing code to a remote process
Now that we understand the different methods to interact with other processes, let's see how they can be used to perform code injection. The first step of the injection attack will be to write our shellcode into the remote process memory. As we mentioned, in Linux there is no direct way to allocate new memory in a remote process. This means that we can’t create a new memory section; we’ll have to utilize the existing memory of the target process.
For our code to be able to run, we will need to write it to a memory region with execute permissions. We can find such a region by parsing the previously mentioned procfs maps file, and identifying a memory region with execute (x) permissions (Figure 5).
There are two types of executable regions that we might encounter: writable and non-writable. The following sections will show when and how each of them can be used.
Writing code to RX memory
Applicable to: ptrace, procfs mem
Ideally, we will want to identify a memory region with write and execute permissions, which would allow us to write our code and execute it. In reality, most processes will not have a region with such permissions, as it is considered a bad practice to allocate WX memory. Instead, we will usually be limited to read and execute permissions.
Interestingly, it turns out that this limitation can be subverted using two of the methods that we just described — ptrace and procfs mem. Both of these mechanisms are implemented in a way that allows them to bypass memory permissions and write to any address, even without write permissions. Additional details on this behavior for procfs can be found in this blog post.
This means that, regardless of write permissions, we can always use ptrace or procfs mem to write our code into a remote executable memory region.
ptrace
To write our payload to a remote process we can use the POKETEXT or POKEDATA ptrace requests — these identical requests enable writing a word of data to the remote process memory. By repeatedly calling them we can copy our entire payload into the target process memory. An example of this is shown in Snippet 3.
  ptrace(PTRACE_ATTACH, pid, NULL, NULL);
  wait(NULL);

  // write payload to remote address
  for (size_t i = 0; i < payload_size; i += 8, payload++)
  {
    ptrace(PTRACE_POKETEXT, pid, address + i, *payload);
  }
Snippet 3: Using ptrace POKETEXT to write our payload to the remote process memory
procfs mem
To write our payload to a remote process using procfs, we simply need to write it to the mem file at the correct offset. Any change that is made to the mem file is applied to the process memory. To perform these operations, we can use the normal file APIs (Snippet 4).
  // Open the process mem file
  FILE *file = fopen("/proc/<pid>/mem", "w");

  // Set the file index to our required offset, representing the memory address
  fseek(file, address, SEEK_SET);

  // Write our payload to the mem file
  fwrite(payload, sizeof(char), payload_size, file);
Snippet 4: Using the procfs mem file to write data to a remote process memory
Write code to WX memory
Applicable to: ptrace, procfs mem, process_vm_writev
As we’ve discussed, both ptrace and procfs mem bypass memory permissions and enable us to write our code to non-writable memory regions. With process_vm_writev, however, this is not the case. process_vm_writev adheres to memory permissions and therefore only allows us to write data to writable memory regions.
Because of this, our only option is to look for writable regions. Not all processes will contain such regions, but we can certainly find ones that do.
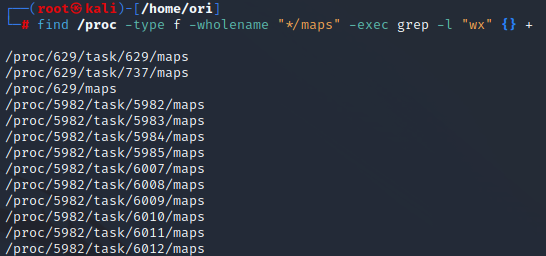
The command in Snippet 5 will scan the maps file of all processes on the system and identify regions with write and execute permissions (Figure 6).
find /proc -type f -wholename "*/maps" -exec grep -l "wx" {} +
Snippet 5: Using the “find” command to identify processes with write and execute memory regions
After identifying such a region, we can use process_vm_writev to write our code into it (Snippet 6).
  // Initialize local and remote iovec structs used to perform the syscall
  struct iovec local[1];
  struct iovec remote[1];

  // Place our payload in the local iovec
  local[0].iov_base = payload;
  local[0].iov_len = payload_len;

  // Point the remote iovec to the address of our wx memory region
  remote[0].iov_base = (void *)wx_address;
  remote[0].iov_len = payload_len;

// Write the local data to the remote address
process_vm_writev(pid, local, 1, remote, 1, 0);
Snippet 6: Using process_vm_writev to write a payload to a remote WX region
Hijacking remote execution flow
After writing our code to the remote process memory we will need to execute it. In the upcoming sections, we will describe different techniques we can use to accomplish that.
Our research focused on amd64 machines. Some small differences might apply for other architectures, but the general concepts should remain the same.
Modifying the process instruction pointer
Applicable to: ptrace
When we attach to a process using ptrace, its execution is paused and we are able to inspect and modify the process registers, including the instruction pointer. This can be done using the SETREGS and GETREGS ptrace requests. To modify the execution flow of the process, we can use ptrace to modify the instruction pointer to the address of our shellcode.
In the example in Snippet 7, we performed the following three steps:
Retrieve the current register values using the GETREGS ptrace request
Modify the instruction pointer to point to our payload address (incremented by 2, which we will discuss later)
Apply the change to the process by using the SETREGS request
// Get old register state.
struct user_regs_struct regs;
ptrace(PTRACE_GETREGS, pid, NULL, ®s);
// Modify the instruction pointer to point to our payload
regs.rip = payload_address + 2;
// Modify the registers
ptrace(PTRACE_SETREGS, pid, NULL, ®s);
Snippet 7: Using ptrace SETREGS to point the instruction pointer to our payload
SETREGS is the “traditional” and most documented way to modify the process registers, but another ptrace request can also be used to accomplish this — POKEUSER.
The POKEUSER request enables writing data to the process USER area — a structure (defined in sys/user.h) that contains information about the process, including the registers. By calling POKEUSER with the correct offset, we can overwrite the instruction pointer with the address of our code and achieve the same result as before (Snippet 8).
  // calculate the offset of the RIP register, based on the USER struct definition
  rip_offset = 16 * sizeof(unsigned long);
  ptrace(PTRACE_POKEUSER, pid, rip_offset, payload_address + 2);
Snippet 8: Using ptrace POKEUSER to point the instruction pointer to our payload
Our implementation of using POKEUSER to modify RIP can be found in our repository.
RIP += 2: When and why?
As shown in Snippet 7 and Snippet 8, when we modify RIP to the address of our payload we are also incrementing it by 2. This is done to accommodate for an interesting ptrace behavior — sometimes after detaching from a process with ptrace, the value of RIP will be decremented by 2. Let’s understand why this is happening.
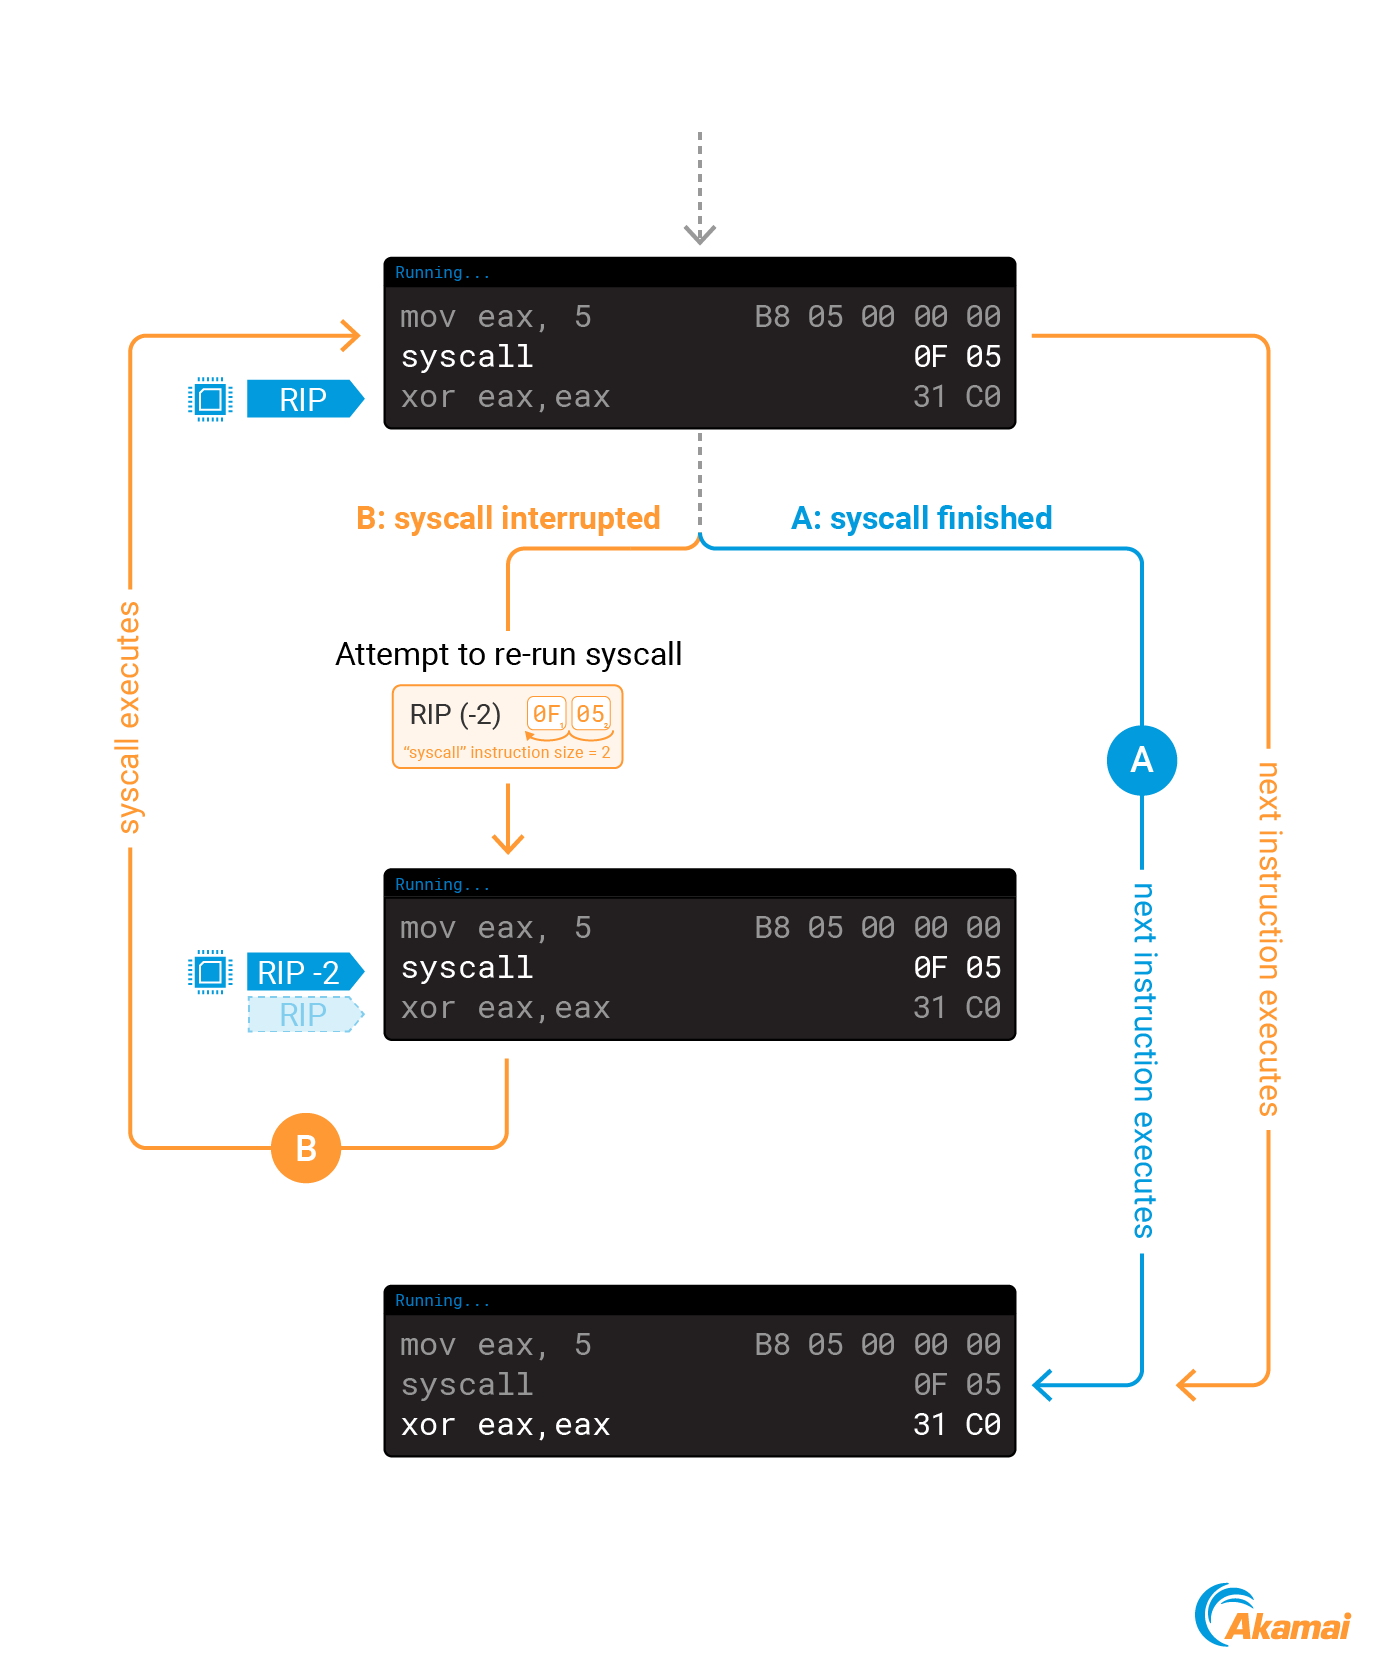
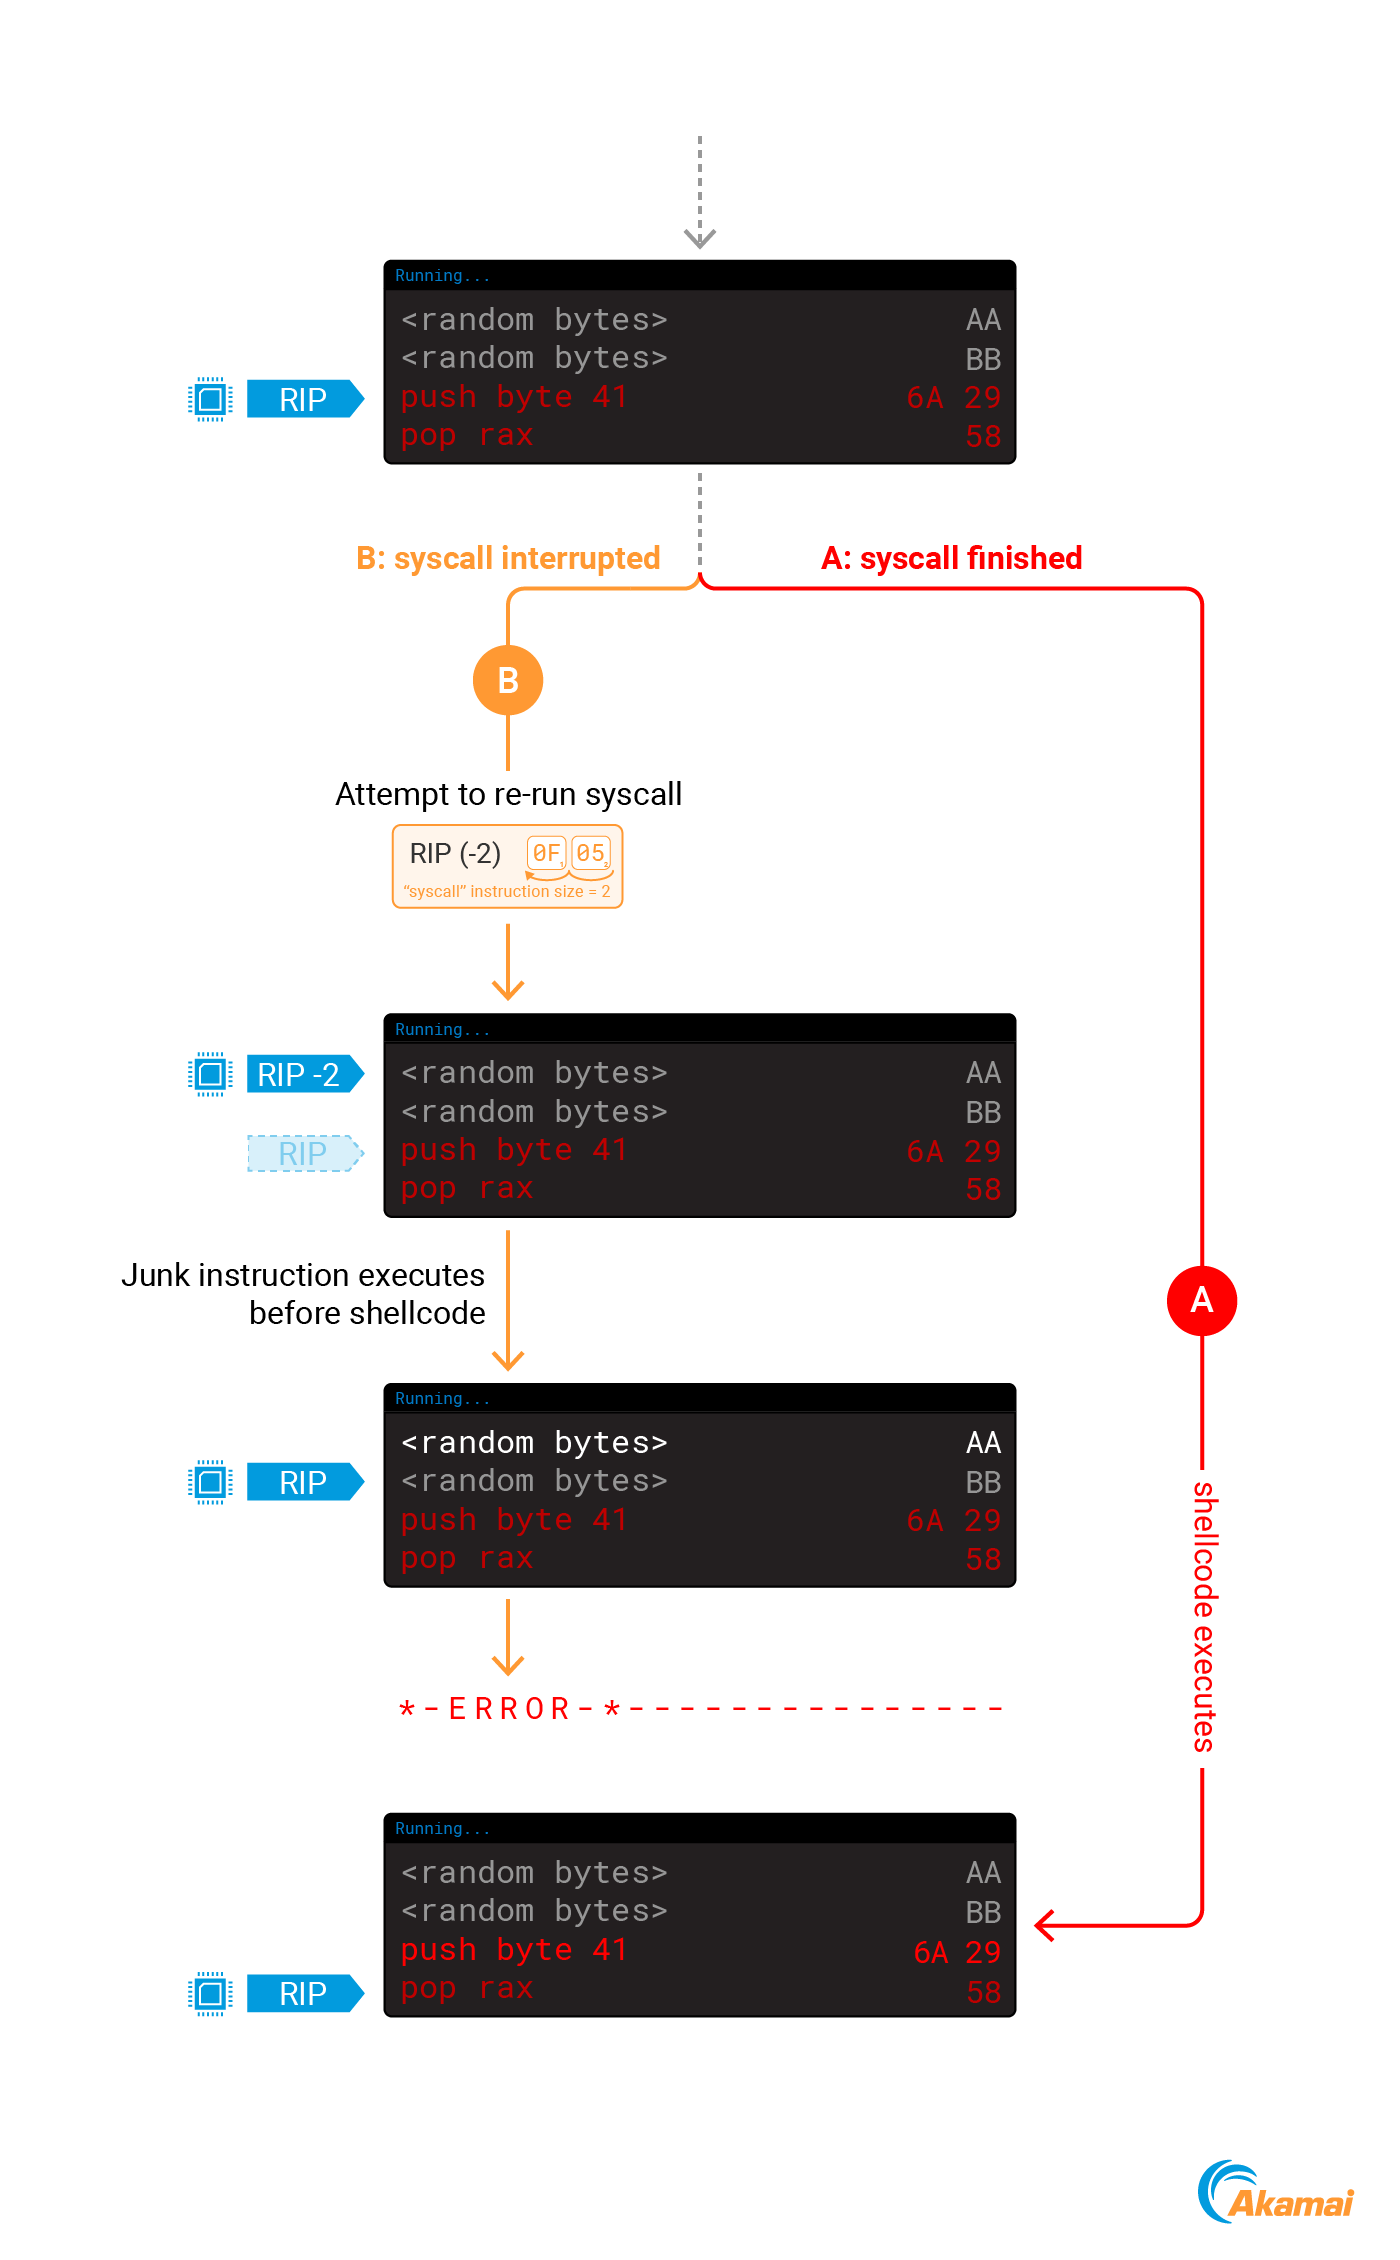
When we attach to a process using ptrace, we may interrupt a syscall that is currently executing in the kernel. To make sure that the syscall executes properly, the kernel will rerun it when we detach from the process.
While the syscall is executing, RIP already points to the next instruction to be executed. To rerun the syscall, the kernel will decrement the value of RIP by 2 — the size of the syscall instruction in amd64. After this change, RIP will point to the syscall instruction again, causing it to run another time (Figure 7).
If we happen to interrupt a process during a syscall when performing code injection, problems can occur. After we modify RIP to point to our code, the kernel will still decrement the new value by 2, leading to a 2-byte gap before our shellcode, which will likely cause it to fail (Figure 8).
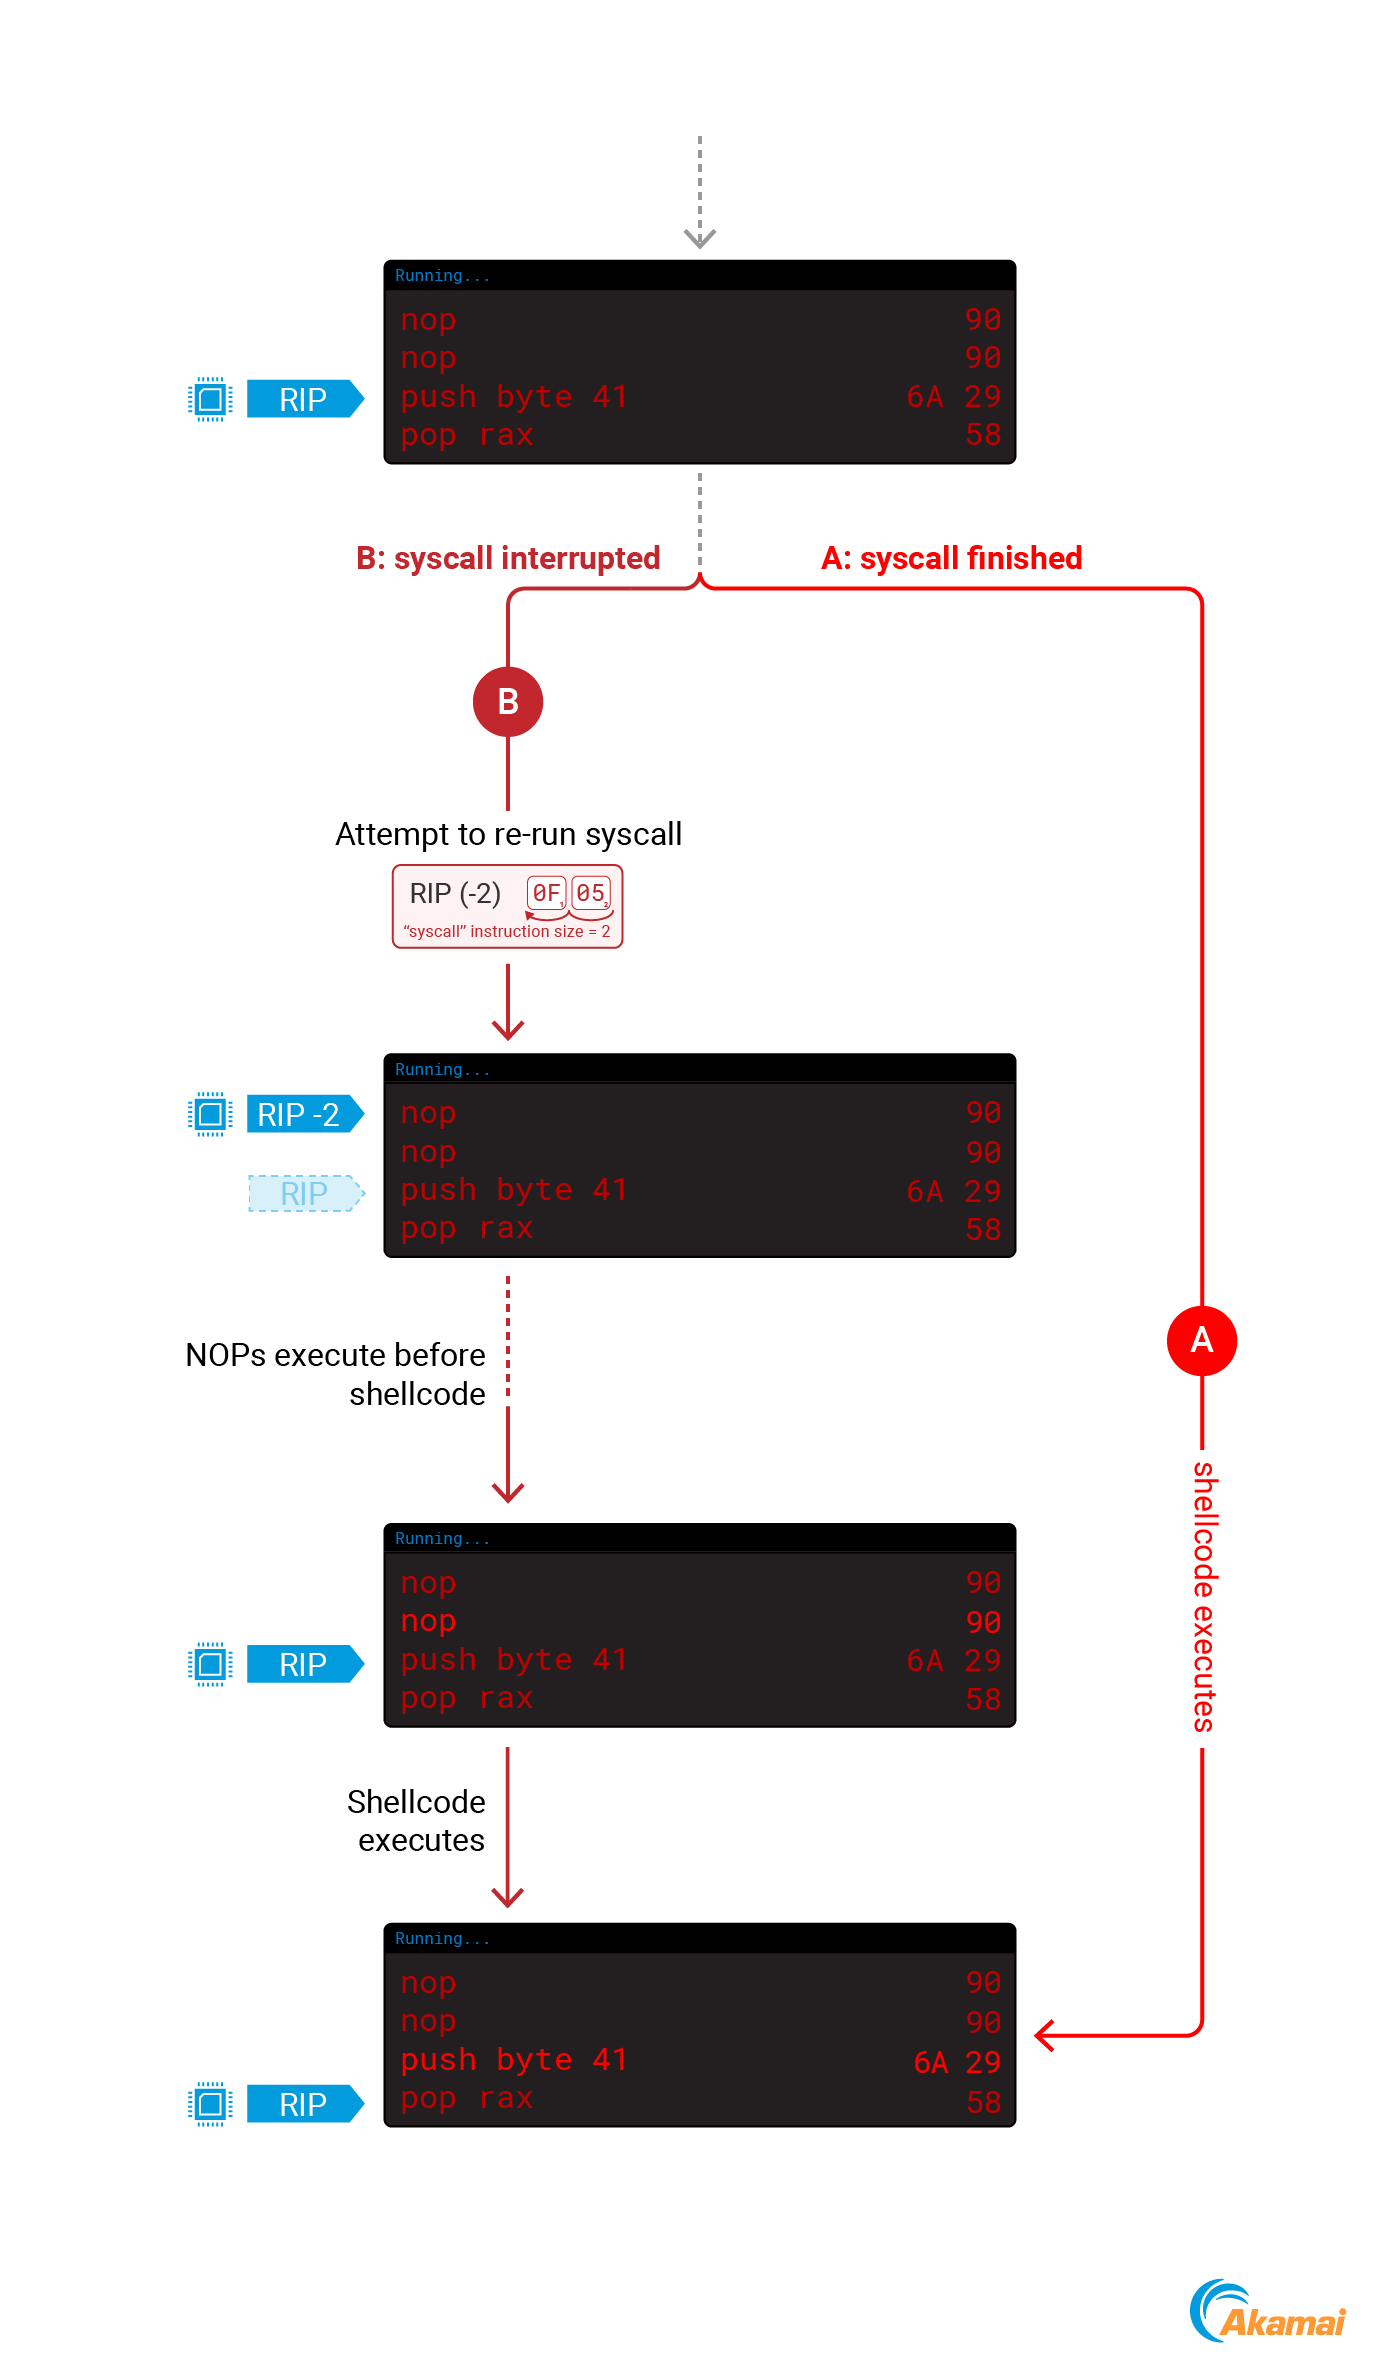
To accommodate for this behavior, we will take two actions: prefix our shellcode with two no operation (NOP) instructions, and point RIP to the address of our shellcode + 2. These two steps will make sure our code executes properly.
If we interrupted the process during a syscall, the kernel will decrement the new RIP value, which will result in it pointing to the start address of the shellcode that contains two NOPs that we will slide into our actual code.
If we didn’t interrupt the process during a syscall, the new RIP will not be decremented, which will result in the two NOPs being skipped and our code executing. These 2 scenarios are depicted in Figure 9.
Modify current instruction
Applicable to: ptrace, procfs mem
Another interesting file in procfs is the syscall file. This file holds information about the syscall that is currently executed by the process — the syscall number, the arguments that were passed to it, the stack pointer, and (most interesting for our cause) the process instruction pointer (Figure 10). Even if the process is not currently executing a syscall, the stack and instruction pointers of the process will still be present in the syscall file.
This information can allow us to take control over the execution flow of the process; knowing the address of the next instruction to be executed allows us to overwrite it with our own instructions.
To implement this, an attacker can perform the following four steps:
Stop the process execution by sending a SIGSTOP signal
Identify the address of the next instruction to be executed by reading the process syscall file
Write shellcode to the identified address
Resume process execution by sending a SIGCONT signal
Snippet 9 provides a pseudo code for this process.
  // Suspend the process by sending a SIGSTOP signal
  kill(pid, SIGSTOP);

  // Open the syscall file
  FILE *syscall_file = fopen("/proc/<pid>/syscall", "r");

  // Extract the instruction pointer from the syscall file
  long instruction_pointer = ...

  // Write our payload to the address of the current instruction pointer using
  procfs mem
  FILE *mem_file = fopen("/proc/<pid>/mem", "w");
  fseek(mem_file, instruction_pointer, SEEK_SET);
  fwrite(payload, sizeof(char), payload_size, mem_file);

  // Resume execution by sending a SIGCONT signal
  kill(pid, SIGCONT);
Snippet 9: Using procfs mem to modify the process memory at the current address of the instruction pointer to hijack the execution flow of the process
The example in Snippet 9 implements this technique using the procfs mem file, but it is important to note that ptrace POKETEXT can also be used to write the payload to memory.
As we’ve mentioned, process_vm_writev is limited by memory permissions, meaning it can only modify writable memory regions. The likelihood of finding code running from a WX memory region is low, which reduces the reliability of process_vm_writev for this primitive.
Check out our implementation of this technique using the procfs mem file.
Stack hijacking
Applicable to: ptrace, procfs mem file, process_vm_writev
Another interesting memory region is the process stack, which can also be identified using the maps file. Although the stack memory is not executable (Figure 11), we can still use it to hijack the execution flow of the process.
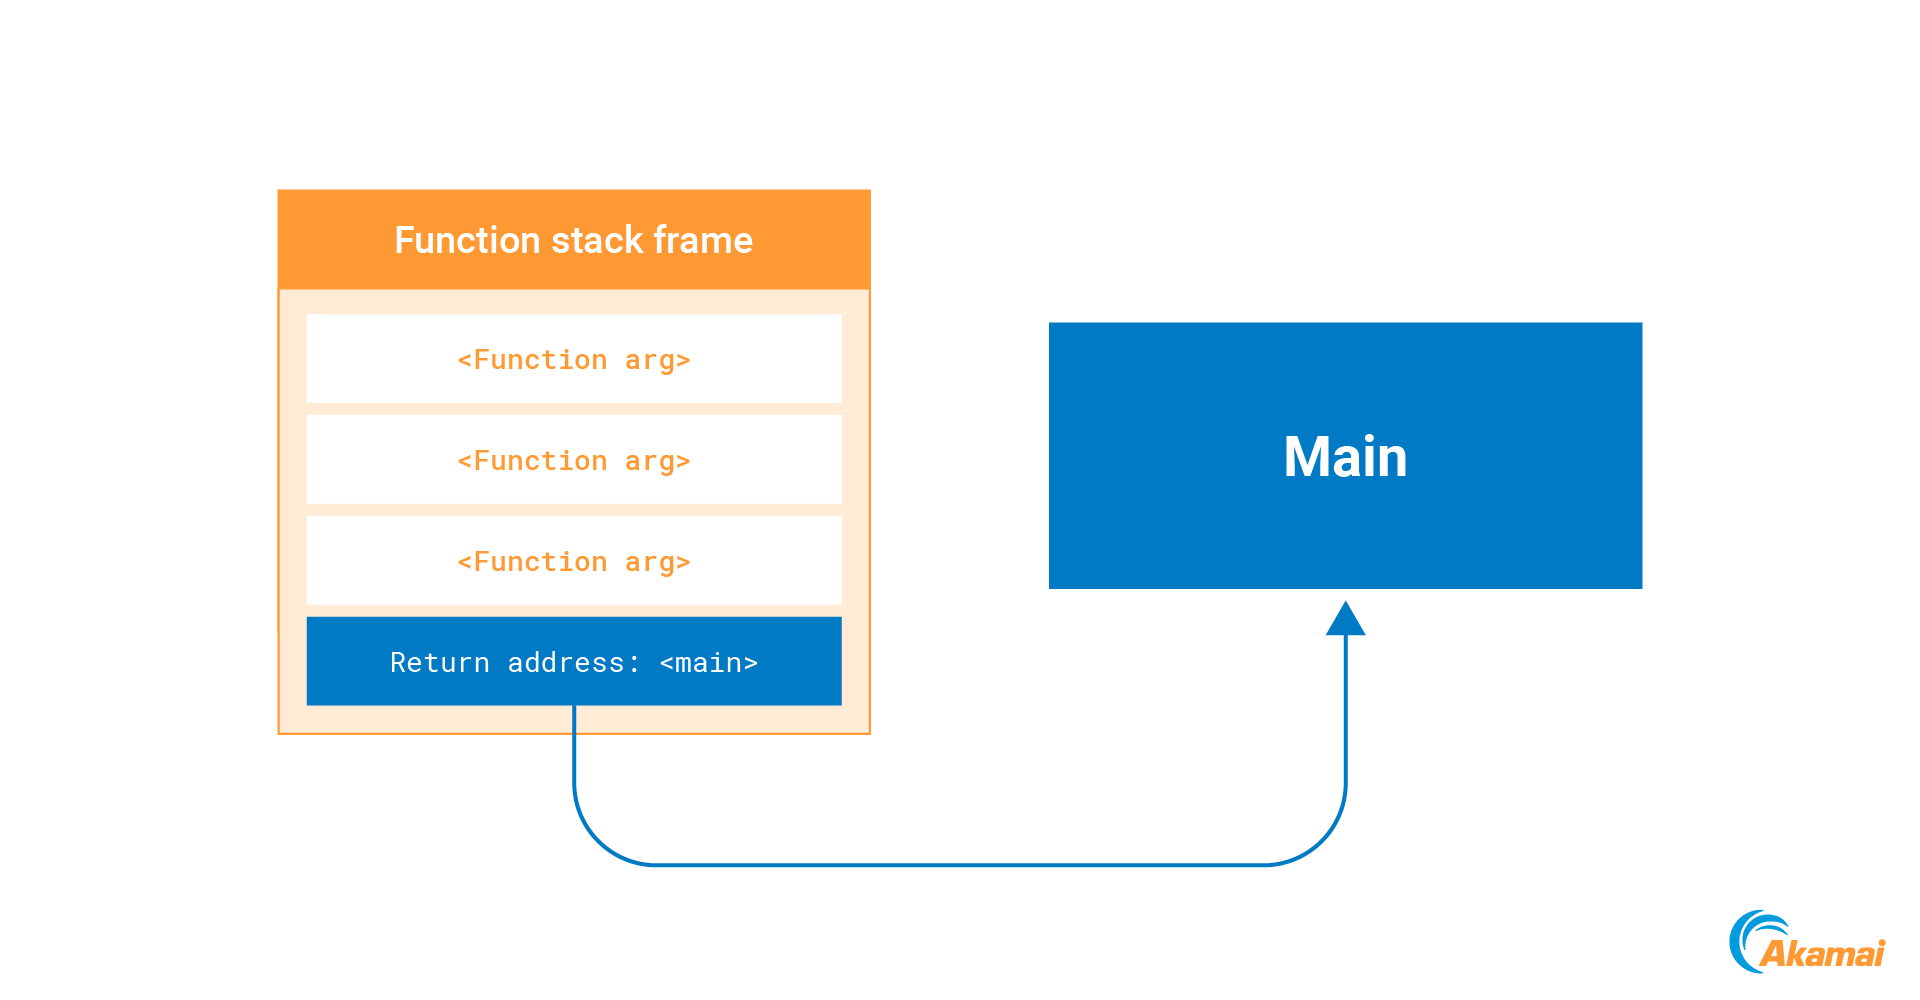
Whenever a function is called, the return address of the calling function is pushed to the stack. When the function finishes execution, the processor takes this return address from the stack and jumps to it (Figure 12).
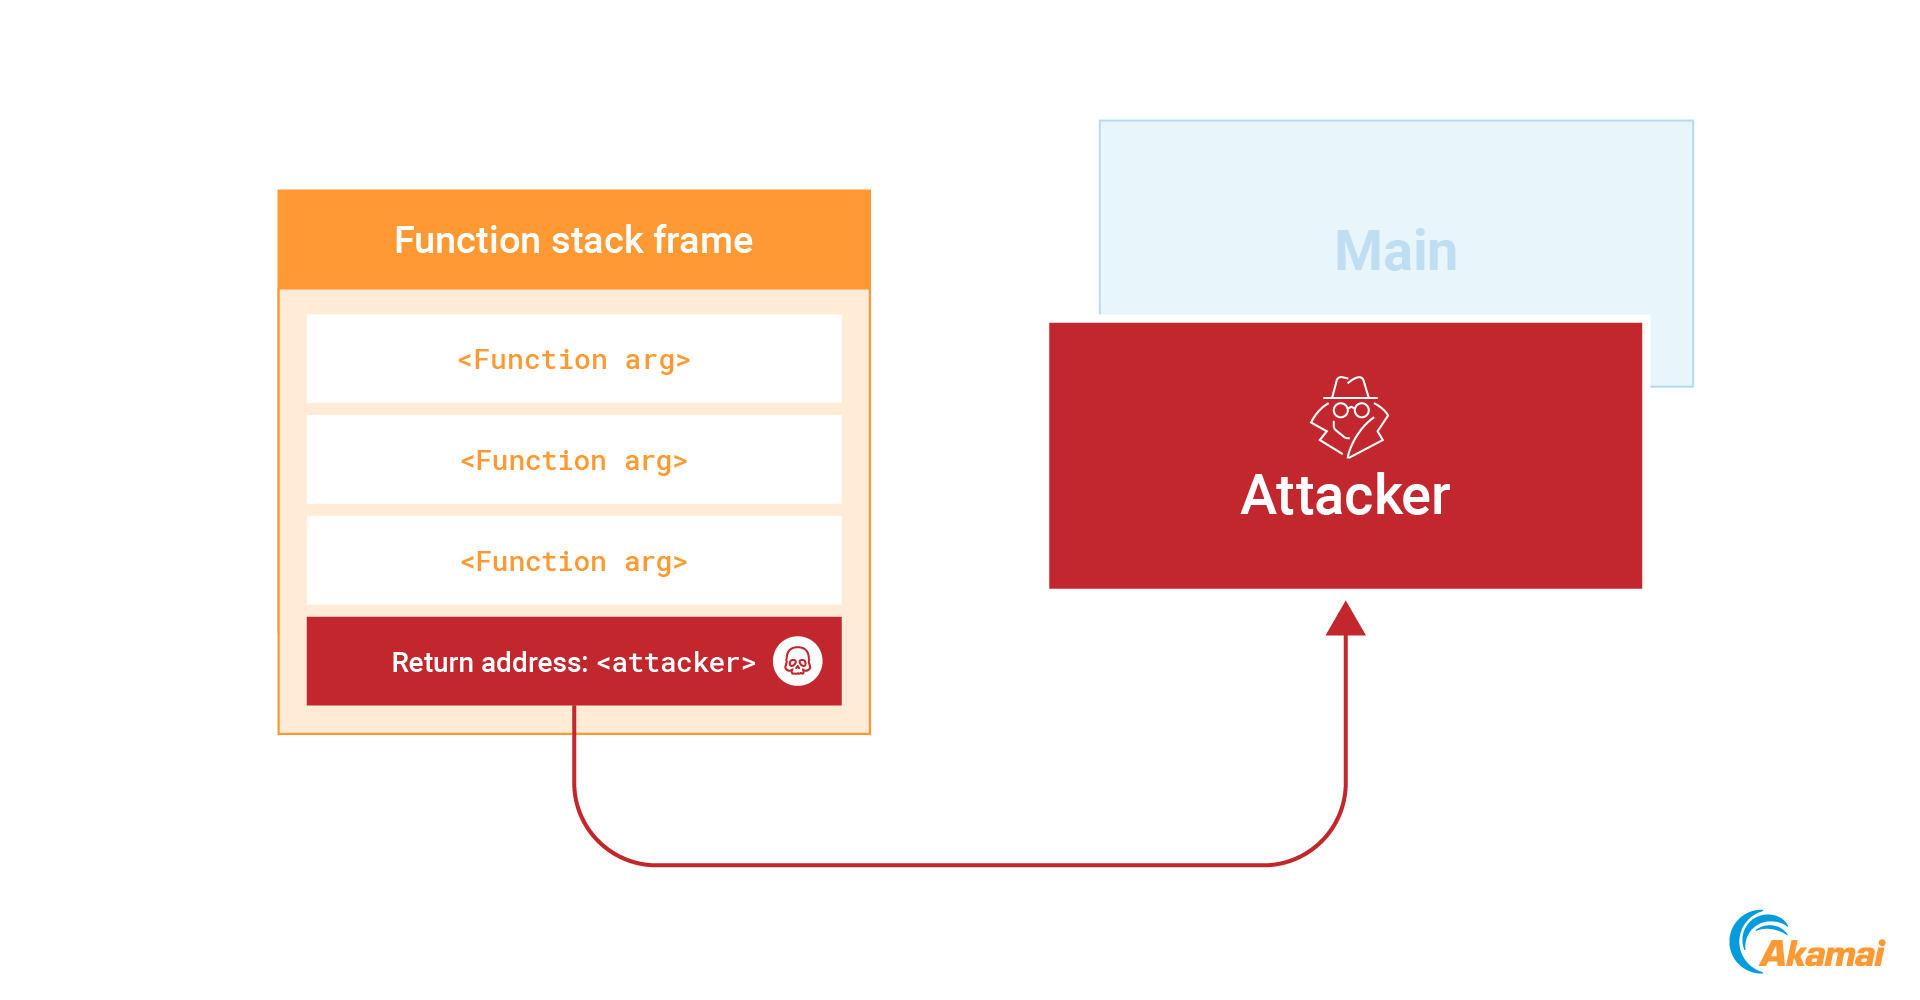
To abuse this mechanism, we can identify a return address on the stack and overwrite it with a new address that points to our shellcode. As soon as the current function finishes execution, our code will run (Figure 13).
To identify the top of the stack we can parse the previously mentioned procfs syscall file, which also contains the value of the stack pointer register.
The following six steps can be used to perform this technique:
Stop the process execution by sending a SIGSTOP signal
Identify the stack pointer of the process by parsing the procfs syscall file
Scan the process stack and identify a return address
Use any of the previously mentioned write primitives to inject our payload to the process memory
Overwrite the return address with the address of our payload
Resume process execution by sending a SIGCONT signal
When the current function finishes execution, our payload is executed.
As all the process interaction methods allow us to modify the stack, they all can be used to implement this technique. Our implementation of this technique using the process_vm_writev syscall can be found in our repository.
ROP stack hijacking
Applicable to: ptrace, procfs mem file, process_vm_writev
The stack hijacking technique is interesting in that it allows us to hijack the execution flow of the process without modifying any executable memory or registers. Despite that, for it to be usable, we still need to jump to shellcode that resides in an executable memory region. We can attempt to find a WX region (as we’ve described) or use ptrace/procfs mem to write to non-writable memory.
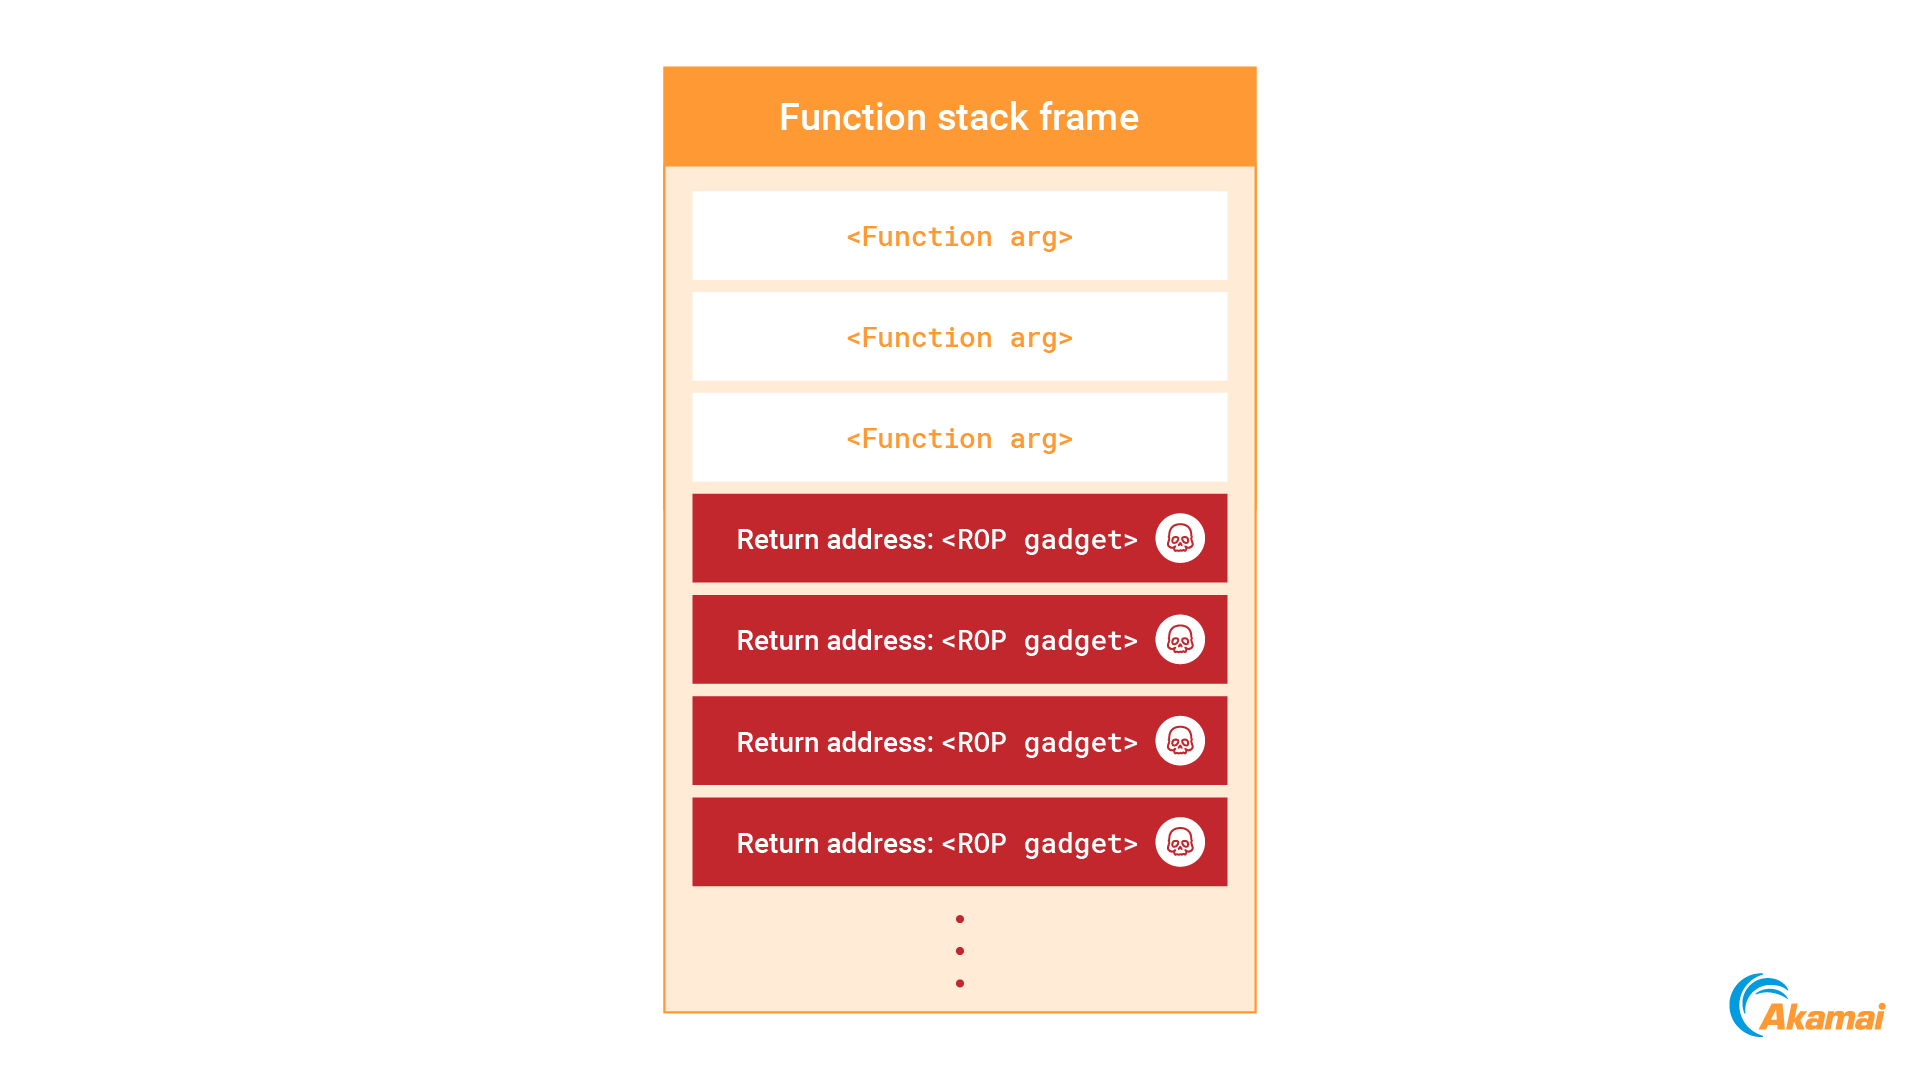
But what if we want to avoid these actions? Well, we have another trick up our sleeve — return-oriented programming (ROP). By using our ability to write to the process stack, we can overwrite it with a ROP chain (Figure 14). As we rely on executable gadgets that already reside in the process memory, we can construct a payload without writing any new executable code.
This technique will consist of the following seven steps:
Stop the process execution by sending a SIGSTOP signal
Identify the stack pointer of the process by parsing the procfs syscall file
Scan the process stack and identify a return address
Use any of the previously mentioned write primitives to inject our payload to a writable memory region without execution permissions
Construct a ROP chain to call mprotect and mark the memory region of our shellcode executable
Overwrite the stack with the ROP chain, starting at the address of the identified return address
Resume process execution by sending a SIGCONT signal
When the current function finishes execution, our ROP chain executes, making the shellcode executable and jumping to it.
This concept was demonstrated by Rory McNamara of AON Cyber Labs in his blog post that covers procfs mem injection.
This technique doesn’t require modifying any non-writable memory regions, and can therefore be performed using all of the process interaction techniques, including process_vm_writev.
Check out our implementation of this technique using process_vm_writev. As far as we are aware, this is the first public demonstration of an injection technique that relies only on the process_vm_writev syscall.
GOT hijacking
Applicable to: ptrace, procfs mem file, process_vm_writev
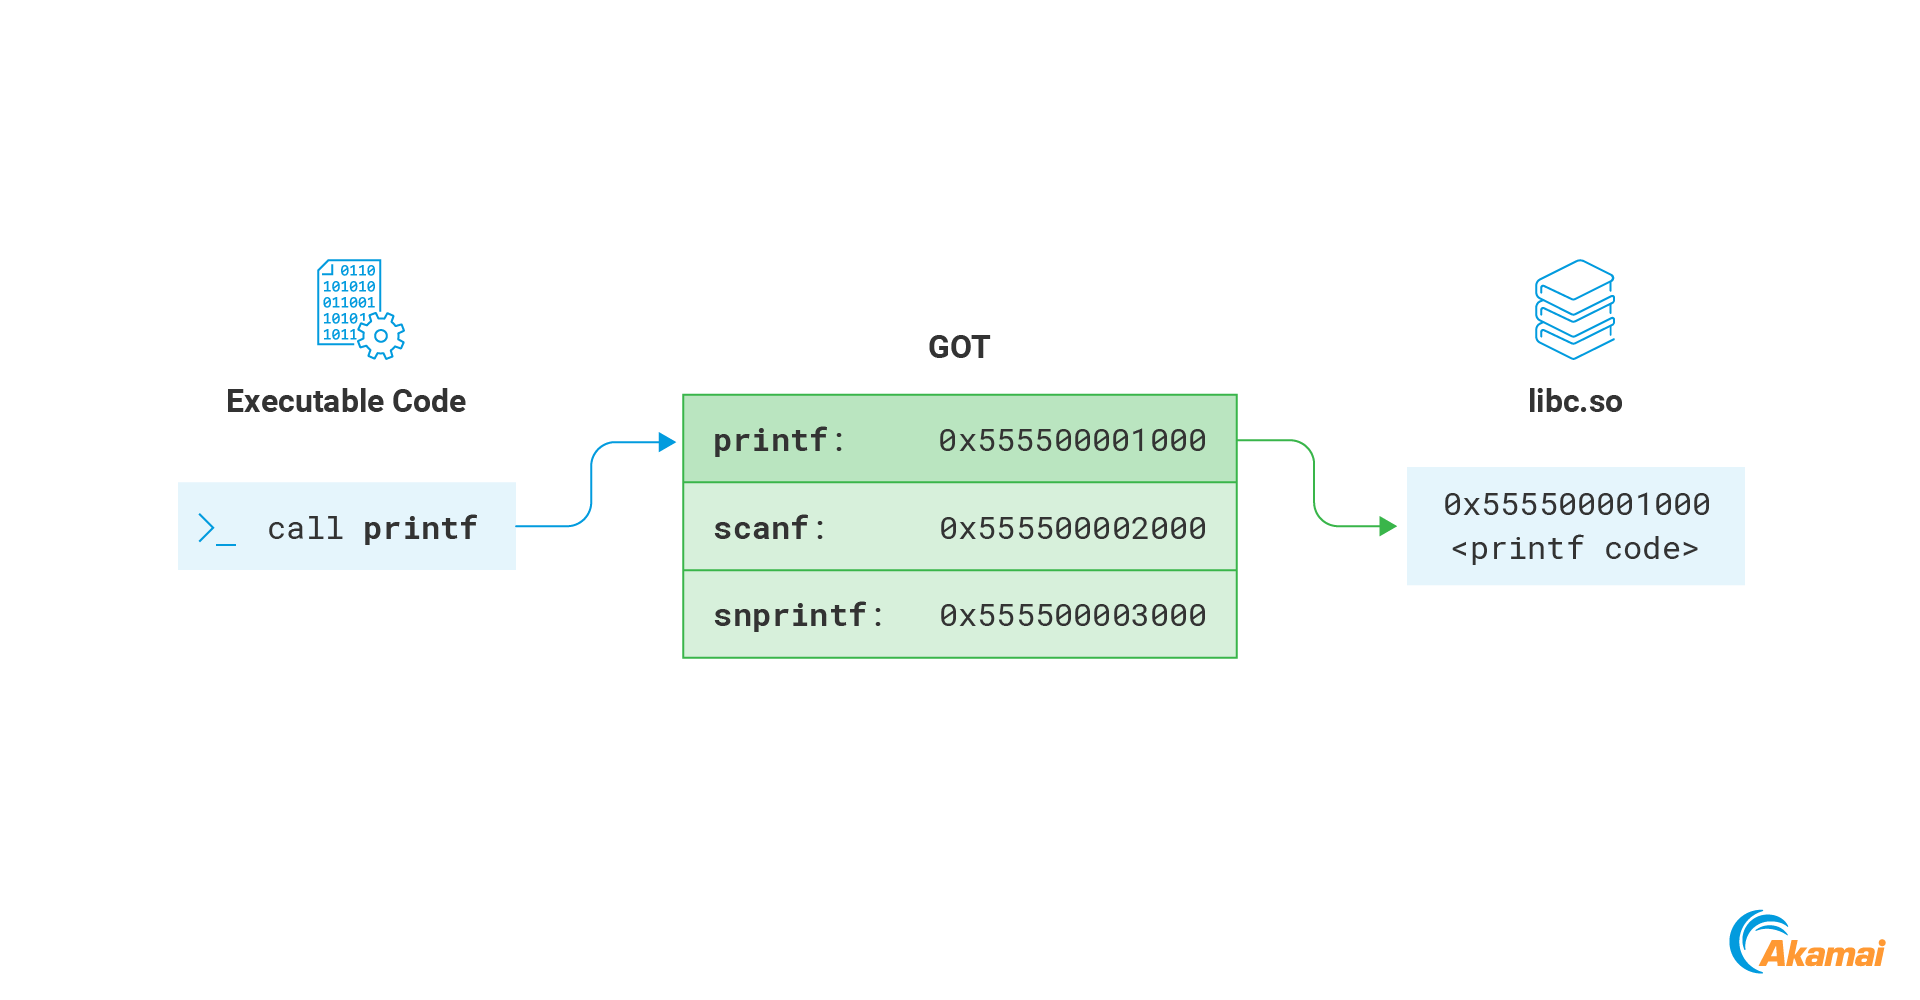
Another interesting memory section that will usually be writable is the GOT. The Global Offset Table (GOT) is a memory section used as part of the relocation process of dynamically linked ELF files. We will not go into the full details here, but rather focus on the part that is relevant for our purpose — the section that stores addresses of functions imported by the program. Whenever the program calls a function from a remote library, it resolves its memory address by accessing the GOT (Figure 15).
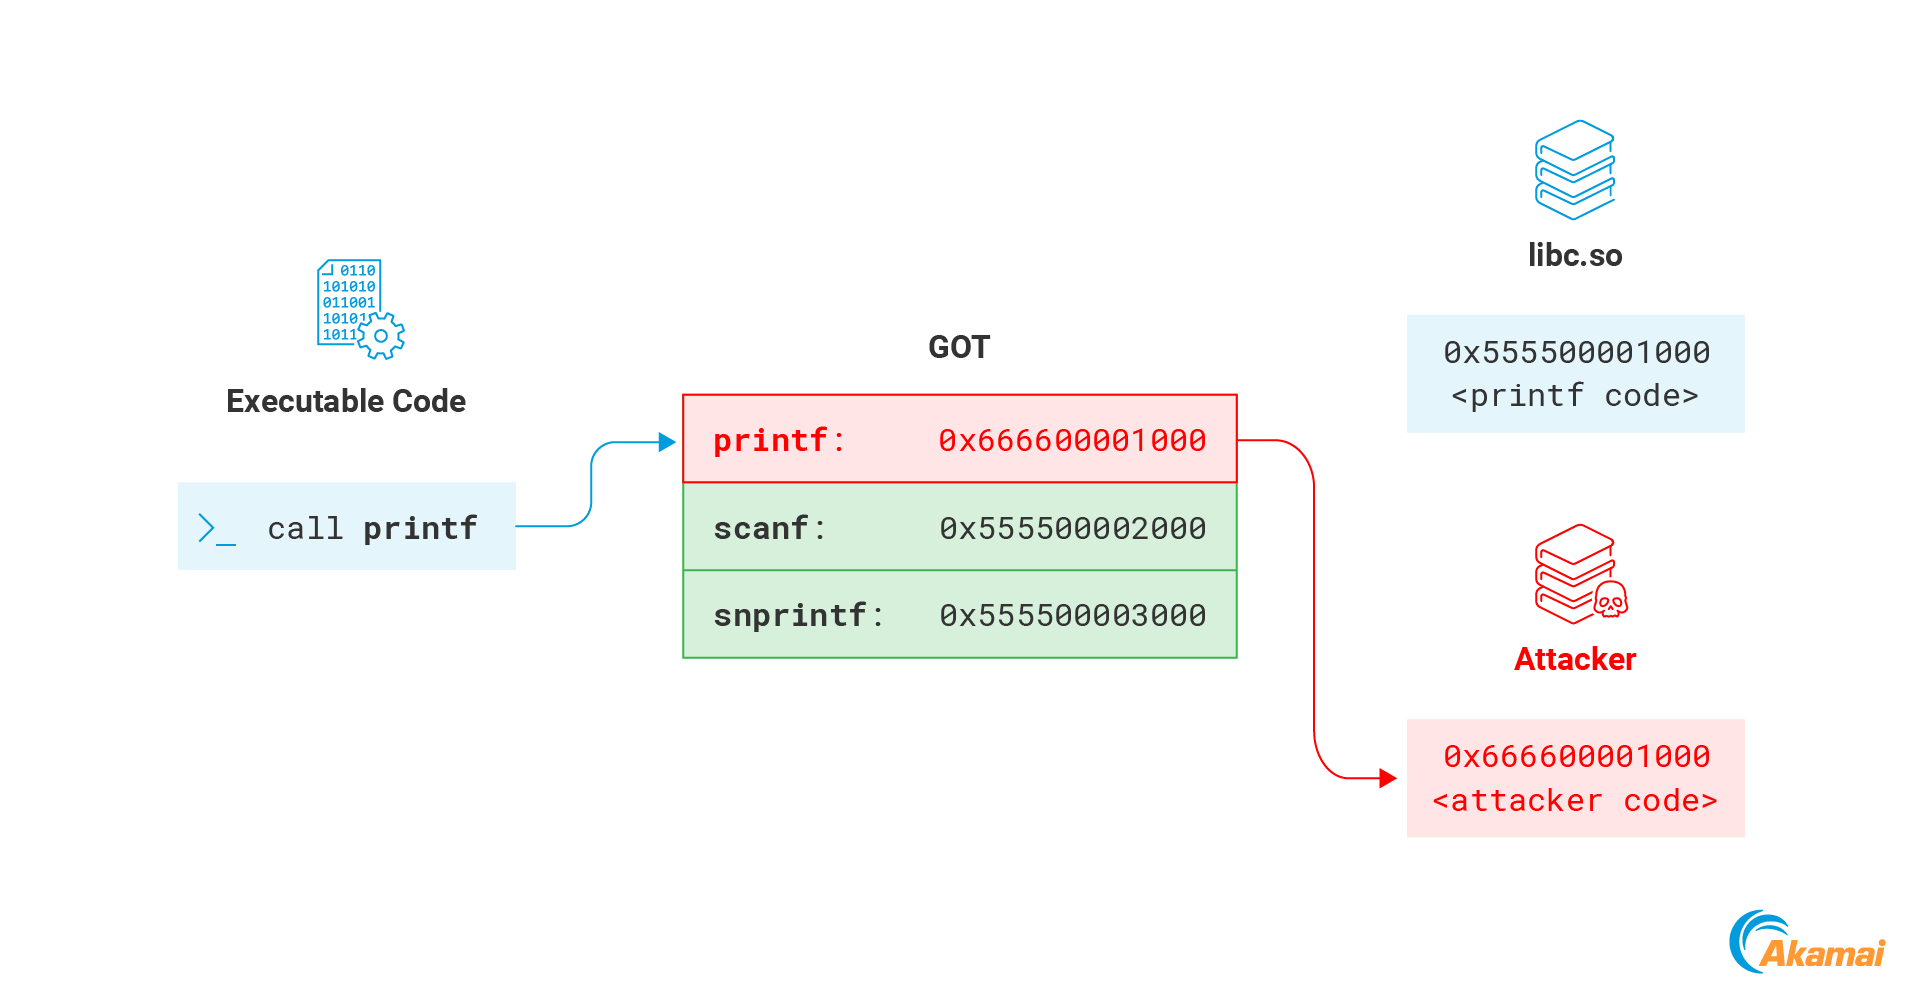
This mechanism can be abused by an attacker to hijack the process execution flow. The GOT memory is normally writable, meaning that an attacker can overwrite any of the addresses inside it with the address of their payload. The next time the function is called by the process, the attacker code will execute instead (Figure 16).
This technique will consist of the following four steps:
Stop the process execution by sending a SIGSTOP signal
Identify the GOT memory region by parsing the maps file
Overwrite addresses in the section with the address of our payload
Resume process execution by sending a SIGCONT signal
When any of our overwritten functions are called, our payload executes.
One memory protection that might affect this attack is full RELRO; compiling a binary with this setting will cause the GOT memory to have read-only permissions and potentially prevent overwrites.
Despite that, RELRO will not be able to prevent this attack in most cases.
ptrace and procfs mem bypass memory permissions, making RELRO irrelevant
RELRO affects the process binary itself but not its loaded libraries. If the process loads any library that was compiled without RELRO, its GOT will be writable, enabling us to overwrite it
Our implementation of this technique using the process_vm_writev syscall can be found in our repository.
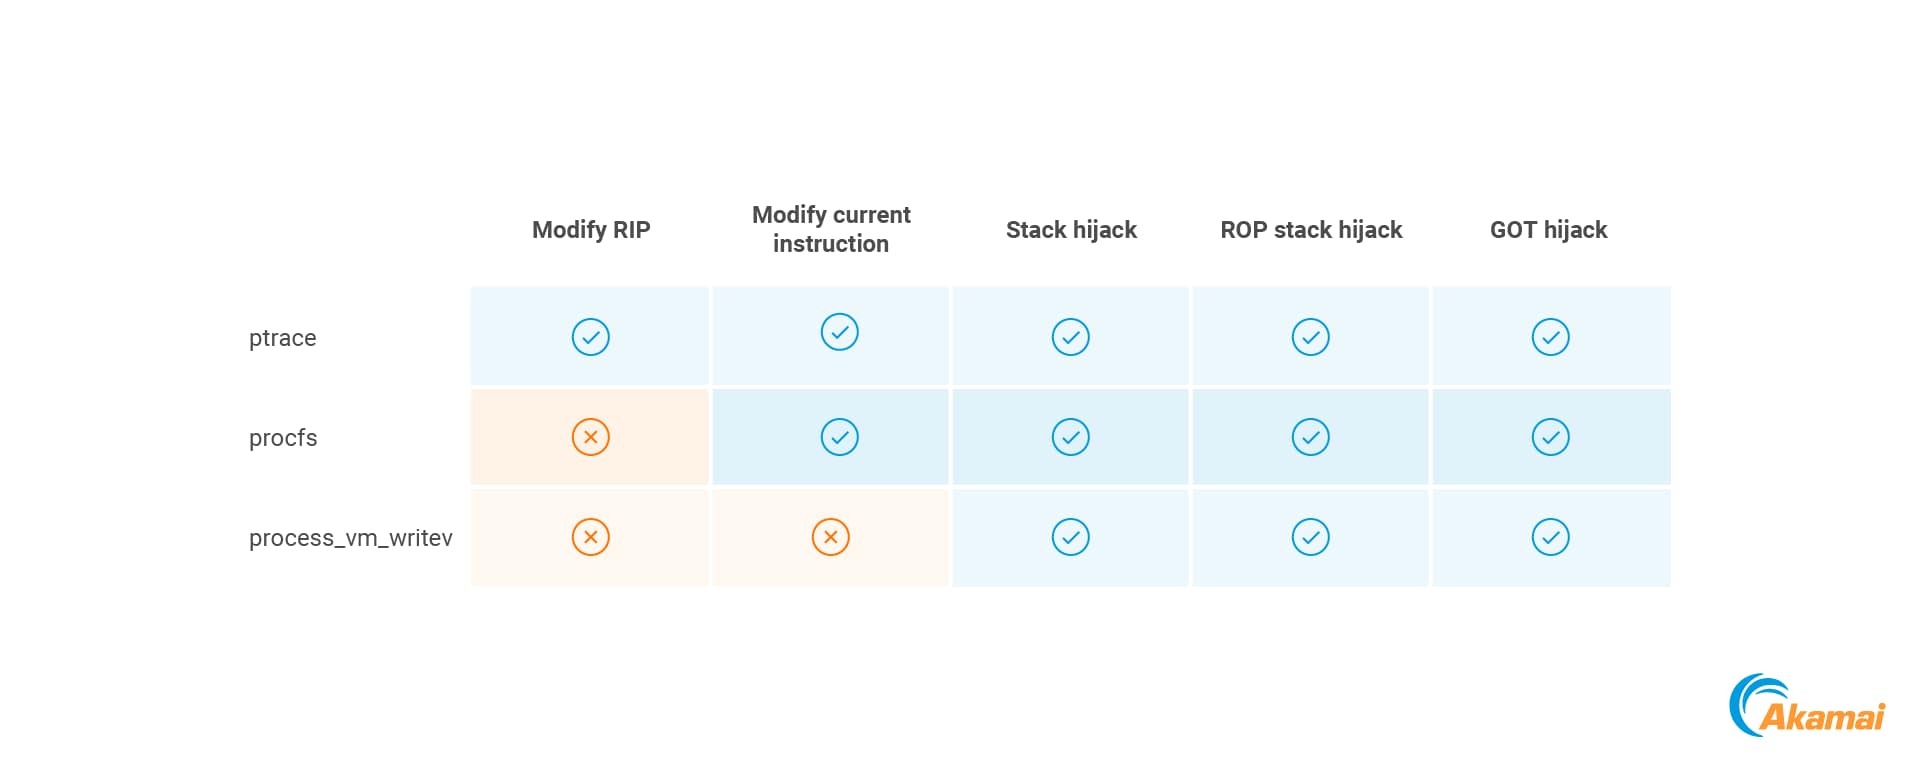
Execution primitives summary
The table summarizes all the possible execution primitives that we described, and with which methods they could be implemented.
Limitations on remote process interaction
There are multiple settings that will determine our ability to interact with remote processes using the methods we just described. In this section, we will briefly cover the two main ones.
ptrace_scope
ptrace_scope is a setting that determines who is allowed to use ptrace on remote processes. It can have the following values:
0 — Processes can attach to any other process on the system, as long as it has the same UID.
1 — Normal processes can only attach to their child processes. Privileged processes (with CAP_SYS_PTRACE) can still attach to unrelated processes. This is the default setting in many distributions.
2 — Only processes with CAP_SYS_PTRACE are able to attach to processes. This capability is usually granted only to root.
3 — Attaching to remote processes is disabled.
Despite its name, this setting will also affect the ability to access the procfs mem file of remote processes, and to use process_vm_writev on them.
The “dumpable” attribute
Every process in Linux is configured with the “dumpable” attribute, which is set to true by default. A process will become undumpable automatically under certain circumstances, or configured as such manually by calling prctl.
If a process is not dumpable, we will not be able to access it remotely with any of the previously mentioned methods. This setting will override other ones — an un-dumpable process cannot be remotely modified.
A note on process recovery
All the injection methods that we highlighted require modifying the process state in some manner — modifying the process registers, or overwriting executable memory, a return address on the stack, or the GOT. All these actions will alter the normal execution flow of the process and will lead to unexpected behavior after our payload finishes.
This can be problematic when we want the target process to continue running alongside our injected payload. To make sure the process continues to run normally, we will need to restore its original state. The general recovery flow will consist of the following eight steps:
Back up the memory content that we intend to overwrite by using a remote read primitive
Back up the current content of the process registers; this could be performed using ptrace or by our shellcode
Execute our payload (e.g., load a shared object (SO) file that runs code in a separate thread)
When our payload completes, indicate to the injecting process that execution is finished; this could be implemented by raising an interrupt
Pause the remote process
Restore the process register state
Restore overwritten memory
Resume the process execution
The implementation details will vary slightly depending on the injection method used, but this general outline should be followed. Adam Chester’s Linux ptrace injection blog post provides a detailed example of process recovery after a ptrace-based injection.
Our goal with this post was to provide an overview of injection techniques, which defenders can use to familiarize themselves with the techniques and then build appropriate detection. As our focus is on defense, we chose to not detail the recovery steps for the different techniques, which attackers need to fully weaponize them.
Detection and mitigation
As we just discussed, there are plenty of techniques that enable attackers to perform process injection on Linux machines. Luckily for us, all these methods require performing anomalous actions that provide detection opportunities. The next sections will detail the different strategies that could be implemented to detect and mitigate process injection on Linux.
“Injection syscalls”
Throughout this post, we used three methods to interact with remote processes: ptrace, procfs, and process_vm_writev. Because of their potential for malicious use, these methods should be monitored.
Start by installing a logging solution on Linux machines. Syscall execution monitoring can be enabled by using an eBPF-based logging utility such as Sysmon for Linux or Aqua Security’s Tracee (that already implements rules that cover many of the techniques described in this post).
After establishing logging, we recommend that organizations analyze the normal use of the “injection syscalls” in their environment and build a baseline of known valid use cases. After such a baseline is created, any deviation from it should be investigated to rule out a potential attack. Additional per-syscall considerations are described in the next sections.
Ideally, use ptrace_scope when possible to limit the usage of these syscalls or to prevent it entirely.
ptrace
In most production environments, usage of the ptrace syscall will likely be pretty rare. After establishing a baseline of valid ptrace usage, we recommend analyzing any abnormal ptrace usage.
The following ptrace requests allow the modification of remote processes, and should be considered highly suspicious:
POKEDATA/POKETEXT
POKEUSER
SETREGS
procfs
Writing to the procfs mem file has some legitimate use cases, but this behavior will probably not be very common. After building a baseline of valid use cases, we recommend analyzing any abnormal write operations.
It’s important to also consider the /proc/<pid>/task procfs directory. This directory exposes information about the different threads of the process. Each thread will have its own procfs directory, which will contain all the major procfs files we covered, including the mem, maps, and syscall files.
In Figure 17, we can see that reading the syscall file from the /proc/<pid> directory is equivalent of reading from the /proc/<pid>/task/<pid> directory, which represents the main thread of the process.
process_vm_writev
Once again, by building a baseline of legitimate uses of this syscall, we can identify anomalous deviations. Any unknown process that writes to the memory of other processes should be considered suspicious and analyzed.
Detect process anomalies
In addition to detecting process injection directly, we can also attempt to detect its side effects. When code is injected to a remote process, it will change the way it behaves. In addition to the normal actions taken by the process, the actions of the payload are now also performed by the same process.
This change in behavior can provide a detection opportunity. By building a baseline of normal process behavior, we can identify suspicious deviations from it that may indicate that code injection occurred. A few examples of such behaviors can include spawning anomalous child processes, loading of SO files that were previously not seen, or communicating over abnormal ports.
Akamai researchers documented this approach and demonstrated how to identify code injection by analyzing network anomalies.
Summary
Attackers have plenty of different options to perform injection attacks on Linux machines. Although these techniques can be very useful for attackers, they also provide valuable detection opportunities for defenders. By implementing solid logging and detection capabilities on Linux machines, organizations can improve their security posture significantly.


