Give Me an E, Give Me a T, Give Me a W. What Do You Get? RPC!

Table of contents
The content in this blog was originally presented at BlackHat USA 2023.
MS-RPC: Fraying the protocol to detect attacks
We’re continuing our dive into MS-RPC, with yet another blog post. But this time, instead of focusing on the offensive side and looking for vulnerabilities, we’ll discuss some of Windows built-in defensive capabilities. We’ll see how to utilize them to catch a glimpse of what is going on under the RPC hood, hopefully detecting nefarious activity along the way.
MS-RPC is integral to the Windows operating system, which consequently means that many lateral movement paths go over it. Attacks like PSExec, Remote Scheduled Task, DCSync, and PetitPotam are all carried out over MS-RPC protocols and it can be difficult to discern benign from malicious network traffic, with just traditional network metadata (source and destination port and IP address; sometimes also process information).
We will bolster our visibility with the Event Tracing for Windows (ETW), a built-in tracing and monitoring mechanism in the Windows operating system. ETW provides us with a treasure trove of information, specifically for RPC, especially when compared with traditional network metadata.
The concept of tracking RPC events by using its ETW provider isn’t new, and there are many good resources and tools already available for it (we link to some of them in our References section; let us know if you’re aware of any additional ones). Most existing research focuses on client-side events, which attackers can tamper with or modify the program to circumvent logging entirely. Instead, we’ll focus on detecting attacks using server-side events, which are outside the attackers’ reach, and see the unique considerations we need to parse them.
In this post, we’ll see how to consume and parse events from the RPC ETW provider, and how to scan events for potentially malicious activity. Using the ETW provider, we can also see the exact operation that is being requested, which gives us a much finer granularity with which we can detect attacks. We’ll see exactly how that works in a bit.
Remind me: What’s RPC?
RPC stands for remote procedure call, and it’s a form of interprocess communication (IPC). Specifically, this protocol is designed to allow remote function invocation between different processes. In our case, we’ll focus on Microsoft’s implementation, MS-RPC.
MS-RPC is designed as a client-server model. The server defines the interface it will expose using the interface definition language (IDL). Inside the IDL we have a universally unique identifier (UUID) for the interface, as well as the function definitions for the functions it exposes (Figure 1).
  [
    uuid(12345678-4000-2006-0000-20000000001a)
]

interface Test
{
    void Foo([in] int number,  [in] char *message);
    void Bar([out] int * result);
}
Fig. 1: An example IDL interface definition
Communication is carried over certain transport protocols, and each transport has its own kind of endpoint (Figure 2). The best way to explain this is with an example: RPC communication can be carried over TCP, in which case the transport is TCP and the endpoint is the TCP socket, identified by a port number.
Transports |
Endpoints |
|---|---|
TCP Named pipe UDP ALPC HTTP Hyper-V socket |
<port number> <pipe name> <port number> <ALPC port> <hostname> <UUID> |
Fig. 2: The common transport protocols and their respective endpoint types
It is important to note that while functions have a readable name in the IDL file, they are identified differently over the network. Instead of a string name, they are identified by an integer, called opnum (shorthand for operation number). It is usually assigned per the order of appearance of the functions in the IDL interface definition (so, in the example in Figure 1, Foo will be identified using opnum 0, while Bar will be opnum 1). This is important later, when we will need to know the opnum of relevant functions to identify them in the data that we’ll see.
For a longer and more in-depth overview of MS-RPC, you can refer to our previous post, or to one of our conference presentations at HexaCon or DEF CON on the topic.
#define ETW
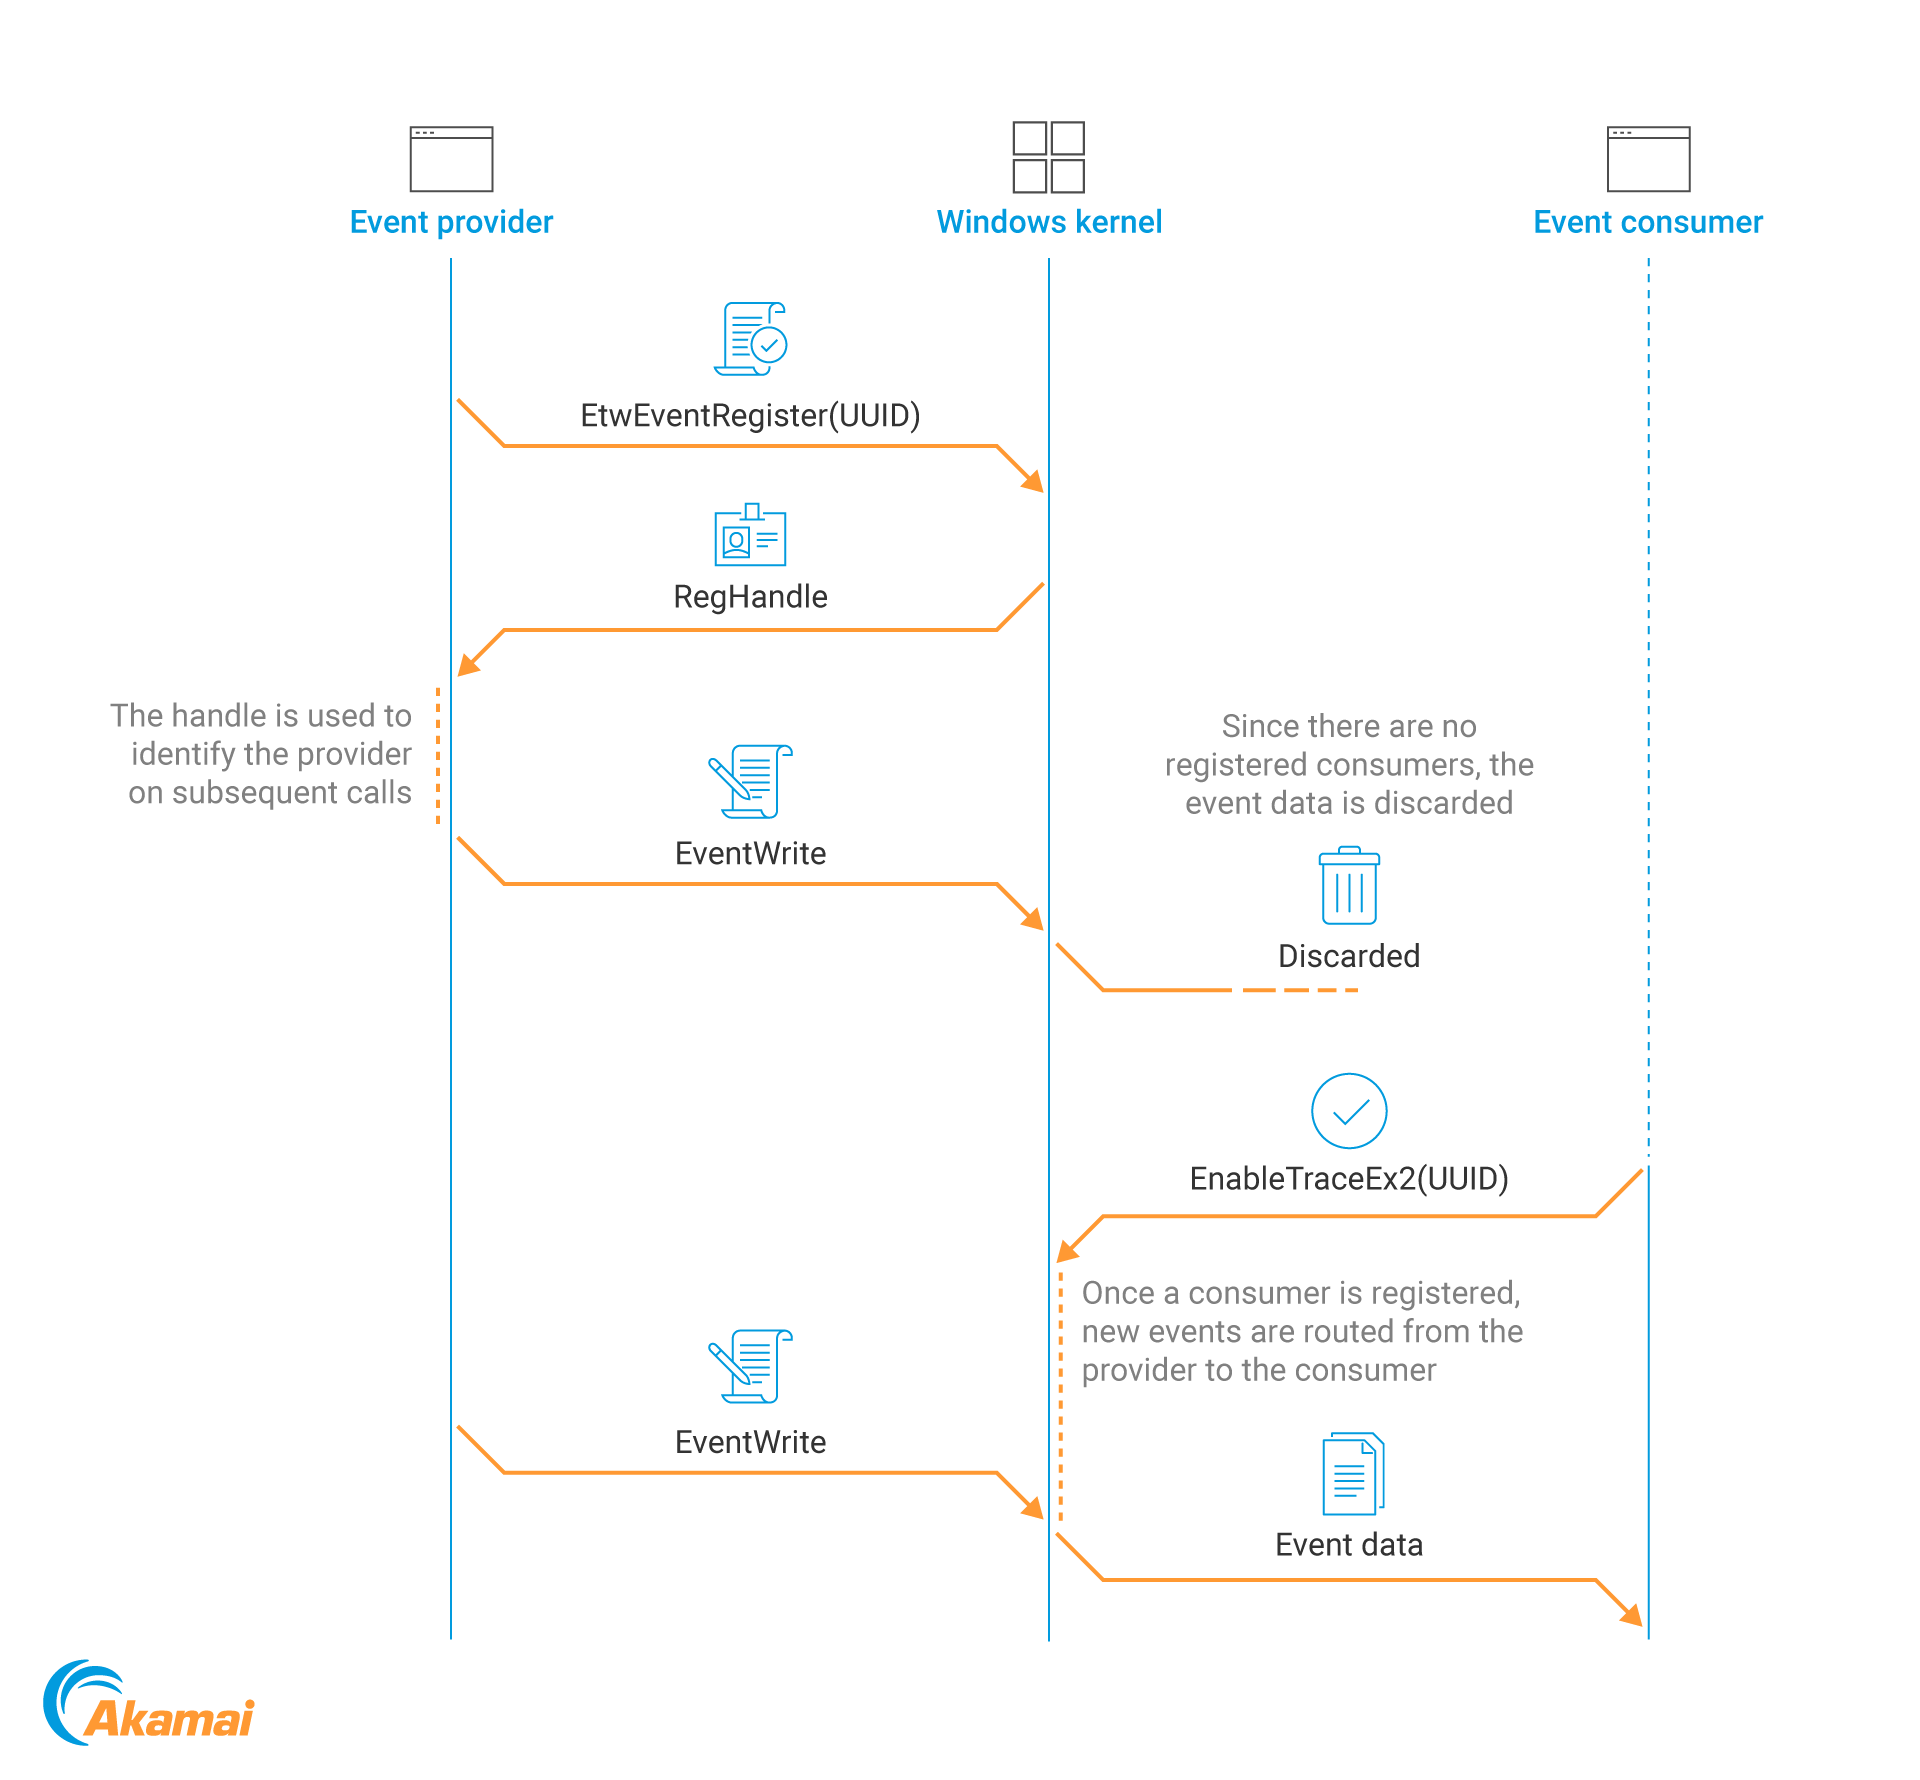
Event Tracing for Windows (ETW) is a built-in tracing and logging mechanism, implemented inside the Windows kernel. It works in a provider-consumer model; providers send events to the kernel, which reroutes them to any consumer programs. Both providers and consumers have to register with the kernel in advance (Figure 3).
Also, since event routing is handled by the kernel, if events are sent by providers but there are no consumers for them, the events are simply discarded and sent to the void.
 Fig. 3: An illustration of the ETW event-reporting flow
Microsoft-Windows-RPC
The RPC ETW provider is implemented inside the RPC runtime, rpcrt4.dll. It has 13 different events, but we’re mostly interested in four of them — events 5 and 7 for client call start and stop (respectively), and events 6 and 8 for server call start and stop. We’ll focus on the call start events (Figure 4), since they provide the most information. (The call stop events simply tell the RPC return status.) Both client and server events share the same format.
  <template tid="RpcServerCallStartArgs_V1">
     <data name="InterfaceUuid" inType="win:GUID"/>
     <data name="ProcNum" inType="win:UInt32"/>
     <data name="Protocol" inType="win:UInt32"/>
     <data name="NetworkAddress" inType="win:UnicodeString"/>
     <data name="Endpoint" inType="win:UnicodeString"/>
     <data name="Options" inType="win:UnicodeString"/>
     <data name="AuthenticationLevel" inType="win:UInt32"/>
     <data name="AuthenticationService" inType="win:UInt32"/>
     <data name="ImpersonationLevel" inType="win:UInt32"/>
  </template>
Fig. 4: RPC ETW call start event schema
Theoretically, the data in the event should provide us all the metadata we need to gain insights into RPC traffic — we now know what is requested from the interface UUID and opnum, and we also know the source or destination address (depending on whether we’re looking at client or server events), via the NetworkAddress field. It can’t be that simple, can it?
It isn’t. Turns out, the RPC runtime doesn’t fill the NetworkAddress field when processing server call events, so we’ll need to find some other way to find that data if we want to have the connection metadata. Client events do have this field filled.
 Fig. 5: A screen snippet from the RPC runtime; highlighted is the field for the network address, which we can see is 0
This does raise the question: Can we ignore server events and rely only on the client side? The answer for that is no. Since we’re trying to find malicious behavior, which will originate from the attacker’s controlled machine, we can’t be sure they won’t tamper with the client-side ETW provider (and turn it off, or block its events), nor can we be sure they’ll even go through the RPC runtime.
The popular python library Impacket, which is often used in attack proofs of concept (PoCs) and tools (and contains implementations of network attacks, like PSExec), implements the RPC traffic inside it, so any attackers using it will circumvent the RPC runtime and won’t be registered in the ETW provider. Since server events are outside of the attackers’ control, it is more prudent to rely on them, which is why now we’ll focus on how to get the network data from elsewhere and match it to the RPC event.
Matching RPC events to network flows
We take a break from our focus on the RPC ETW provider to look at other ETW providers, namely the TCP and SMB providers. Those two protocols are the common transport protocols for RPC traffic. Since we said that the RPC endpoint type depends on the transport protocol, we can match the endpoint (port number, pipe name, etc.) as we receive it from the RPC provider to the respective value in the transport ETW provider.
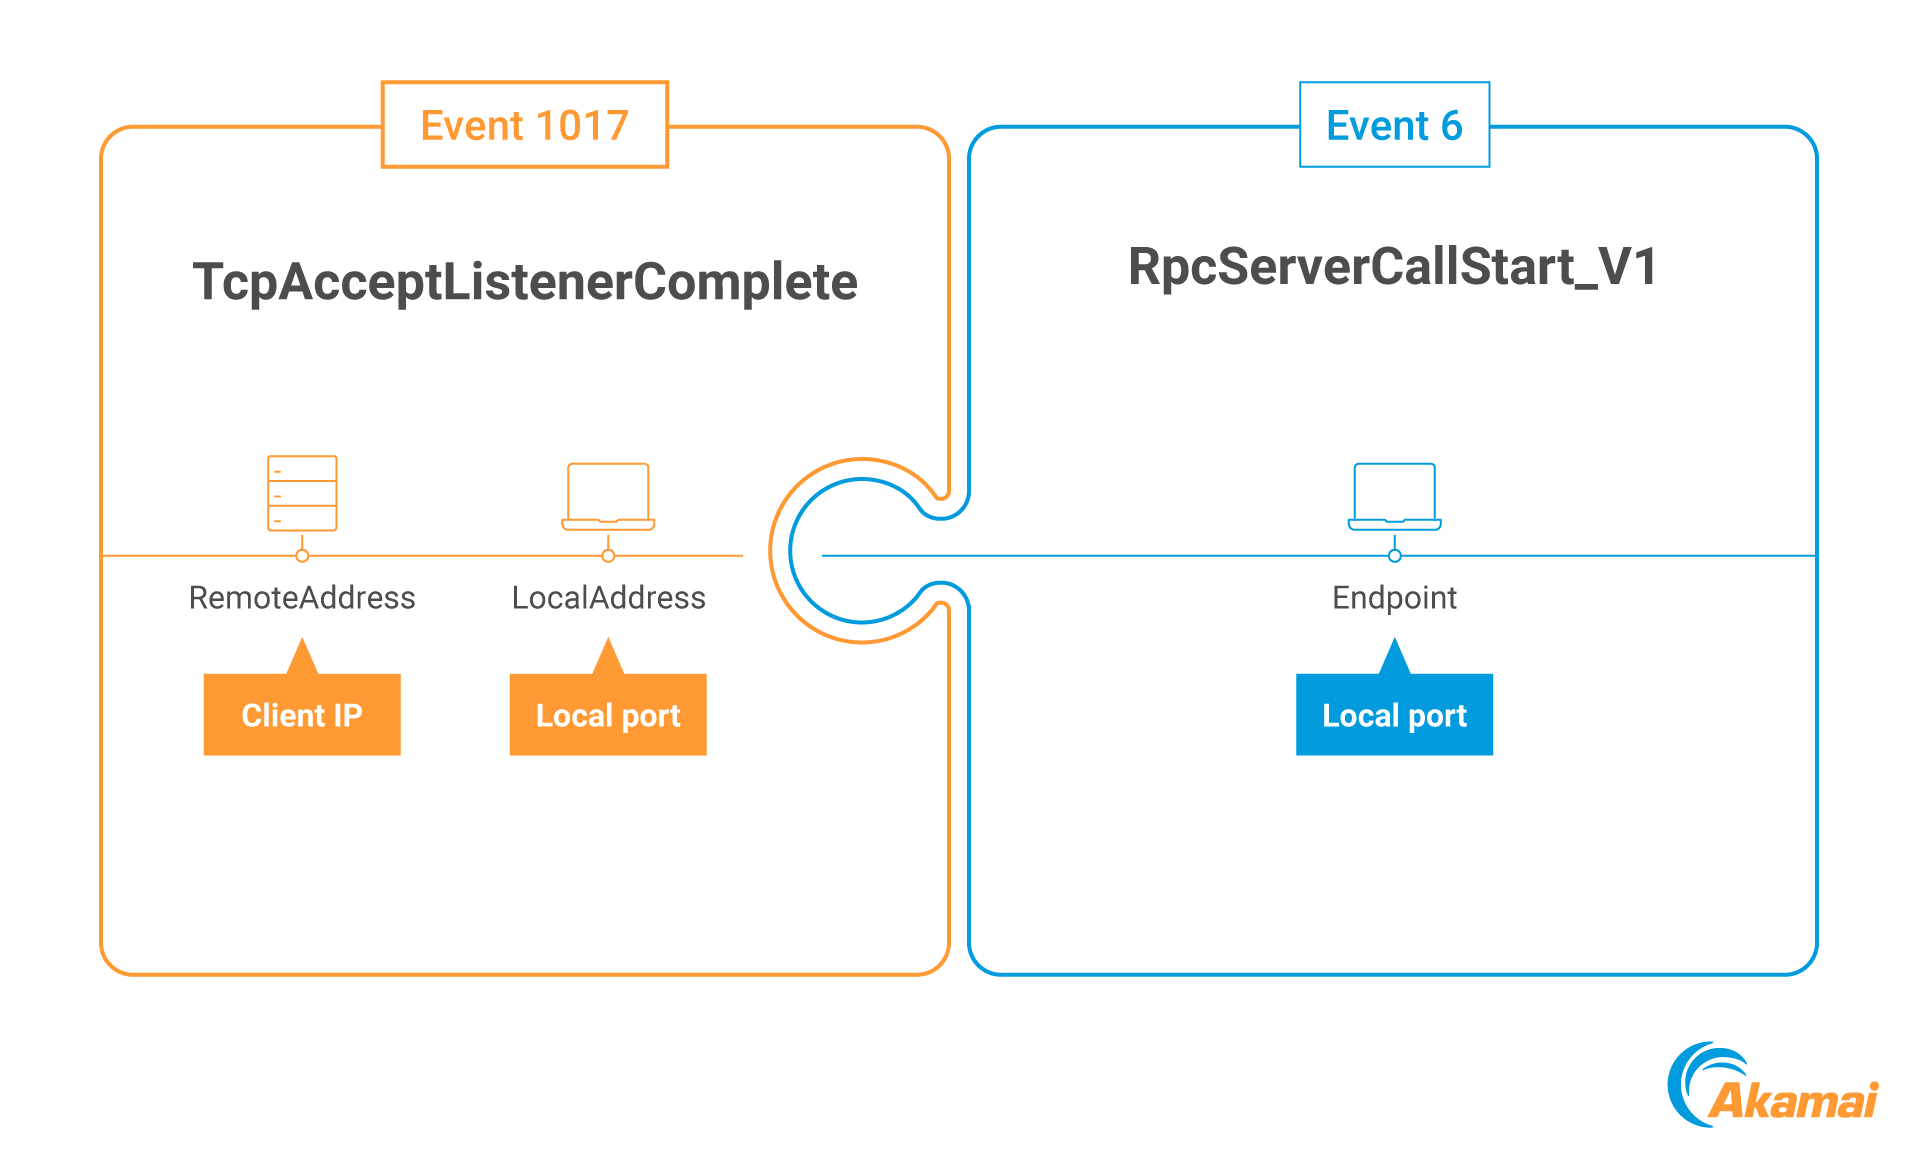
For TCP, it’s pretty simple. Let’s look at event ID 1017, called TcpAcceptListenerComplete, which triggers once the TCP three-way handshake is completed.
It has two fields (basically): LocalAddress and RemoteAddress (though, in our case, since we’re looking at server events, local refers to the server whereas remote refers to the client). The address fields’ values are in binary, and contain the address family, IP address, and the port number (Figure 6).
0 |
1 |
2 |
3 |
4 |
5 |
6 |
7 |
|---|---|---|---|---|---|---|---|
Address family |
Port number |
Address value (IP if AF_INET) |
|||||
Fig. 6: The address binary field format
All we have to do is extract the (client’s) IP address from the RemoteAddress field, and track it with the (destination) port in the LocalAddress field. Now, the moment we get an RPC event on our server, over the same TCP port number, we can tell where it came from based on the port-to-ip matching we extracted from the TCP provider (Figure 7).
 Fig. 7: Matching TCP and RPC events
With SMB, the situation is a tad more complicated as different bits of information appear in different ETW events. The endpoint is a named pipe, which is the same as a file, but multiple files can be accessed over the same SMB session. So, in this case, to match the endpoint with its network source, we have to keep track of two events: one for the actual connection and one for the file request (Figure 8).
For the connection event, we have event ID 500, Smb2ConnectionAcceptStart, which is triggered when the SMB connection is established. We get the source IP and a connection UUID from it. Then we look for event ID 8, Smb2RequestCreate_V2, which contains the requested filename and the same connection UUID field. Now, we just need to cross-reference both events via the connection UUID to match the pipe name to the IP that requested it (and later on, we’ll need to match the pipe name to the RPC call endpoint).
 Fig. 8: Using SMB ETW events to match source IP to RPC ETW events
To save you the hassle of implementing all this matching yourself, we’ve implemented this algorithm, and you can find the RPC Visibility tool in our GitHub repository. The tool is written in Python, and saves the recorded RPC network traffic into a Neo4j database for easy visualization.
Attack detection
Now that we have all the information we need, we can finally turn our attention to detecting malicious RPC flows. The general process is simple: We find an attack that is carried over RPC, run a PoC of it, and see what RPC interface it uses, as well as see the requested operation. Then we can simply create a signature that matches that operation. We’ve included signature queries that work with the Neo4j database implementation in our release, but keep reading for the general logic and conditions.
PSExec
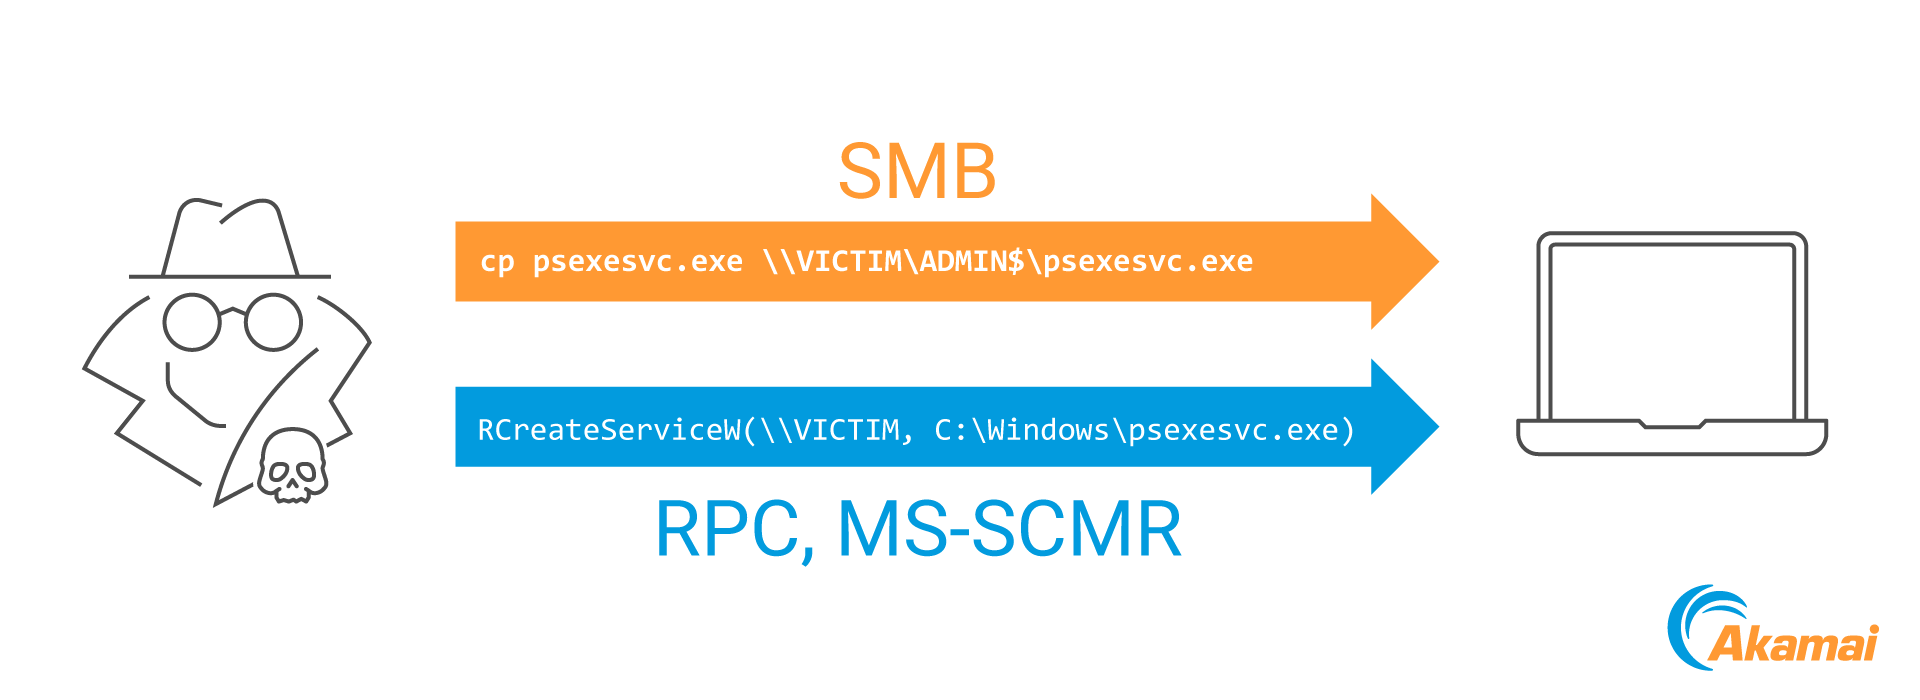
PSExec is both a general name for an attack technique and a Sysinternals tool (the one that gave the technique its name). Basically, the tool copies a service binary into the remote target’s ADMIN$ share (Windows’ installation folder) and then communicates with the service manager via its RPC interface (MS-SCMR) to create a service for the binary and run it (Figure 9).
 Fig. 9: PSExec attack flow
There are a lot of legitimate reasons to contact remote machines over SCMR; watchdogs querying remote service status, for example. There are many fewer reasons to remotely create new services. Therefore, we don’t want to trigger alerts on just any connection over SCMR (which we can detect even without the RPC ETW, simply by matching an incoming network connection to the service manager process services.exe), but only on connections that create remote services.
Accordingly, our signature should be (in broad terms, not specific for our RPC visibility implementation):
interface_uuid == “367ABB81-9844-35F1-AD32-98F038001003” AND (opnum == 0xC OR opnum == 0x18)
where 0xC is the opnum for RCreateServiceW and 0x18 is for RCreateServiceA.
Remote Task Scheduler
Similar to PSExec, the Task Scheduler can be used to launch a remote binary and achieve lateral movement this way. It doesn’t even have to launch a new binary, since it can just as well launch a cmd or PowerShell console, and download a binary hosted online.
Also similarly to PSExec, we don’t want to detect just any access to the Task Scheduler service, but are mostly interested in RPC calls to SchRpcRegisterTask.
interface_uuid == “86D35949-83C9-4044-B424-DB363231FD0C” AND opnum == 0x1
DCSync
DCSync is another RPC-based attack, but aimed at domain controllers. In this case, the attacker connects to the real domain controller, pretending to be a new domain controller. They then ask to replicate the domain controller’s credential database, gaining access to the KRBTGT password hashes.
The replication request occurs over the MS-DRSR RPC interface, and uses the specific function DRSGetNCChanges (opnum 3).
interface_uuid == “e3514235-4b06-11d1-ab04-00c04fc2dcd2” AND opnum == 0x3
PetitPotam
PetitPotam is an authentication coercion attack on the Encrypted File System (EFS) service. Basically, attackers can connect to the EFS RPC interface (MS-EFSR) and tell it to open a remote file specified by a UNC path. It would then trigger an outbound SMB connection with authentication that the attacker can then relay.
When the attack PoC was released, it used EfsRpcOpenFileRaw (opnum 0), which has since been patched. Topotam, the researcher who found the vulnerability, also found that EfsRpcEncryptFileSrv (opnum 4) had the same flaw.
interface_uuid == “c681d488-d850-11d0-8c52-00c04fd90f7e” AND (opnum == 0x0 OR opnum == 0x4)
Drawbacks
Even though there’s a lot of information to be gleaned from the RPC ETW provider, it is not a one-stop shop for all of our security needs. While knowing which operation is requested in each network flow is valuable data, the most crucial information, what data was passed in each request, isn’t logged. This means that lateral movement detection via the ETW provider is still only a heuristics-based approach, though with a lot more context than traditional network four-tuples.
It is also a pure detection method, and can’t be used to stop or respond to attacks. Microsoft does provide us another built-in defense mechanism for RPC — the RPC filter in the Windows firewall. You can read more about that filtering mechanism and learn how to use it in our Definitive Guide to the Remote Procedure Call (RPC) Filter post.
Summary
The RPC ETW provider isn’t some new addition to Windows, but it’s been mostly neglected in consideration for network defense. There are some tools out there that interact and consume events with it, but they are mostly aimed at security researchers, and focus less on the network side of things.
In this post, we’ve discussed how we can use the RPC ETW provider, coupled with the TCP and SMB providers, to glean visibility into the requested RPC operations that come from the network. This provides us with a heuristic-based approach that we can use to detect possible malicious requests that can be used for lateral movement.
References
RPC ETW consumer tools by other security researchers
RpcMon by CyberArk
RpcInvestigator by Trail of Bits
Utilizing RPC Telemetry by Jonathan Johnson of SpecterOps
Our GitHub repository for all things RPC
Offensive Windows IPC Internals 2: RPC by Carsten Sandker
- How to secure a Windows RPC Server, and how not to by James Forshaw


