Holiday Readiness, Part Four: What You Should Be Thinking About One Month Out — Monitoring and Alerting
This is the fourth post in a blog series about Akamai solutions that can help you manage the surge of traffic (both good and bad) that will be hitting the retail industry during the holiday season. Read part one, part two, and part three.
November is here. Now it’s crunch time. Hopefully, implementing the solutions in parts one through three of this series has kept you busy over the last few months. In those articles, we covered security, flash crowd management, disaster recovery, and performance optimization checklists. If you are not in a code freeze yet, work with your Akamai account team to review the content to determine what features you still have time to enable.
In this fourth installment, we will be covering alerting and monitoring to make sure you are aware of the performance, health, and security posture of your website or application during the holiday traffic surge. None of the following recommendations or guidance require any Property Manager or security configuration modifications as I assume that most retailers are already in a code freeze since we’re so close to the holidays. So, let’s start this installment with performance monitoring.
Performance Monitoring
Within the Akamai Control Center (ACC), there are numerous traffic reports that you should become familiar with so you have a proper understanding of the overall health of your website or application. (We covered some of the available traffic reports in parts one and three of this series.).
mPulse real user monitoring
Whether you own an enterprise license for mPulse or are using the lite (free) version, there are some basic dashboards available that can help you gauge the performance that your users are experiencing in real time.
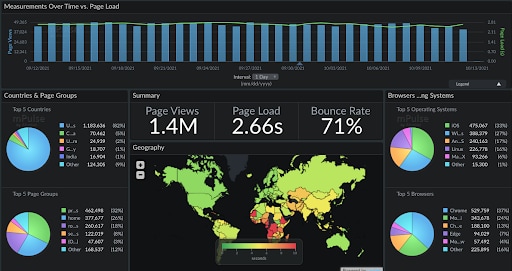
Summary Dashboard
The Summary dashboard is the default dashboard that displays when you first load mPulse. It provides high level information so you can quickly assess the performance of your site across page groups, countries, and devices. The Summary dashboard will also display page views, page load time based on the percentile selected, and the bounce rate over a selected period.
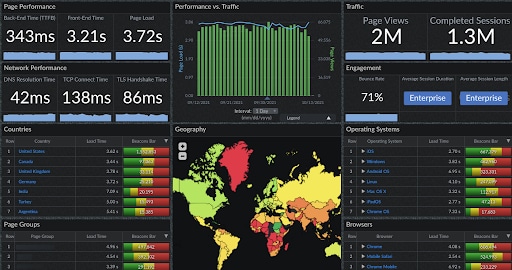
DevOps dashboard
If you require a more technically detailed view of your performance metrics, the DevOps dashboard will provide you with additional technical data points you can monitor. In this dashboard, you can quickly view average DNS resolution times, TCP connect times, and back-end (time to first byte) times versus front-end times. The tables included in this dashboard will also give you an idea of performance by browser, country, operating system, and page group.
Akamai Control Center — Traffic reports
In addition to mPulse, the ACC has multiple reports you can use to better understand the number of hits, bandwidth, and offload you are achieving over time. You can find the reports by clicking on Menu > Traffic Reports.
Unlike mPulse, the traffic reports in ACC use Content Provider Codes (CP codes) to report on traffic. Now is a good time to become familiar with the CP codes that tie into the website or application you want to monitor. You can find the CP codes within your Property Manager configurations.
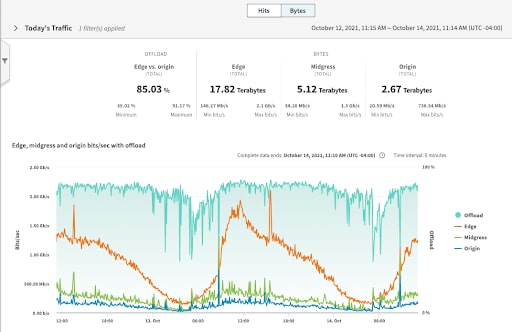
Today’s traffic
Today’s Traffic is a report that provides high-level information from the last 48 hours. Within this report, you can filter by “Hits” or “Bytes” to gain a general understanding of how your website is performing. This report can allow you to quickly identify any major spikes or dips in traffic so you can begin an investigation. You are also able to see your offload percentage and trends over time.
Traffic
The Traffic report is similar to Today’s Traffic, but will allow you to look back at traffic over the last 90 days.
URL Traffic
The URL Traffic report provides insight into traffic-per-URL to help you understand the offload ratios and hit counts for each object on your site over time. This report allows you to look back at traffic over the last 90 days.
Akamai Control Center — Event Center
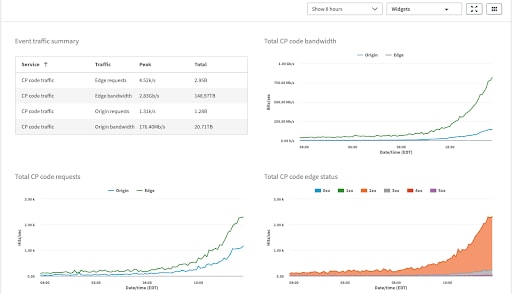
The Event Center within the ACC is a traffic-monitoring dashboard that allows you to quickly see how your website is performing in real time. This is a dashboard that is commonly displayed on “war room” monitors to gauge the health of the traffic browsing your website. You can easily see the amount of bandwidth, hits, and HTTP status codes that end users are experiencing. The Event Center dashboards refresh automatically, which will allow you to react quickly to HTTP error spikes.
Security Monitoring
Customers who own Akamai’s security solutions, such as App and API Protector, should become familiar with the various security reports that are available within the Security Center. Knowing where to look if there is an ongoing attack or even how to casually check in on things will help you gather the information you need.
Web Security Analytics
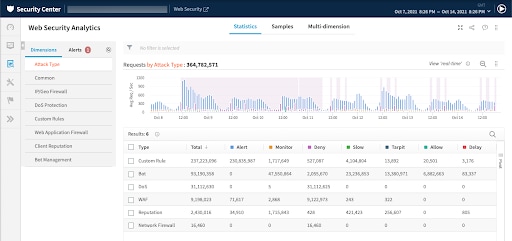
Web Security Analytics (WSA) is a powerful, real-time attack dashboard that allows you to gain an understanding of the attack traffic hitting your website or application. WSA is your one-stop shop to visualize all attack traffic, such as Web Application Firewall rules, DDoS rate controls, Client Reputation, and Bot Manager rules. You can filter as deeply as necessary to identify any malicious payloads. You can filter by specific attack groups, paths, IP addresses, hostnames, query strings, and more. This is arguably the most important dashboard as it relates to security.
Security Center Trends
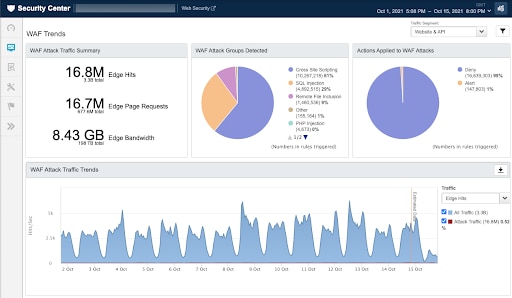
If all you need is high-level information rather than a deep analysis, the Security Center Trends reports are a great resource to see breakdowns of the different types of attacks that are hitting your site. For example, the WAF Trends report details the number of attacks being denied versus alerted, as well as the various types of attacks that the Akamai WAF is observing.
In addition to the WAF Trends reports, you will also find similarly displayed information within the DoS, Client Reputation, and Bot Trends reports.
Performance alerts
In part two of the Holiday Readiness series, we covered the reactive and proactive alerts that can be configured to monitor the health of your infrastructure. You can refer back to that post to review that information.
In addition to origin health monitoring, Akamai also provides the ability to monitor the health of your website from the view of the edge server. For example, you can choose to be alerted if there are a high number of 5XX or 4XX errors on the client to edge connection. Or perhaps your origin health is fine at the moment, but you want to be notified if the amount of requests back to your infrastructure becomes too high. In that case, you can configure the “High Origin Hits” alert.
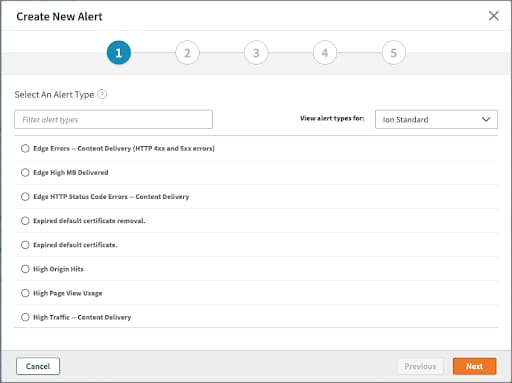
Click here to learn more about all the available performance alerts that can be configured. If you need assistance configuring these alerts, you may work with your aligned Akamai Services team.
Security alerts
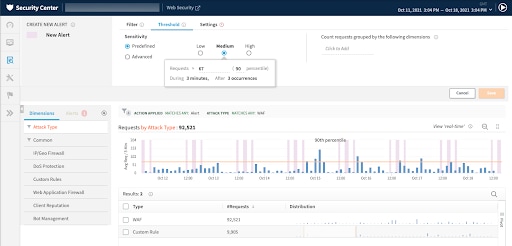
Within the Web Security Analytics dashboard mentioned earlier, you can configure alerts based on incoming attack traffic. This allows you to quickly react to incoming attacks so you can put the proper controls in place for mitigation.
For example, let’s say you still have some WAF rules in alert mode and want to be notified if a high rate of rules is triggered by attack traffic. In the screenshot below, you will notice the filters are configured to match the criteria above, and you can also define the threshold or percentile for alerts, which can reduce the number of notifications you may receive.
When this alert is triggered, you will be notified via email that there is attack traffic matching the criteria you have configured. Email notifications will continue to be sent every 30 minutes until the attack is over or has been mitigated.
If you have the Akamai Managed Security Services package, you may work with your aligned Security Consultant to configure these alerts to be sent to the Akamai Security Operations Command Center (SOCC). In this case, when an alert is triggered, an Akamai SOCC engineer will proactively reach out to you with an analysis of the attack, provide example payloads that triggered the alert, and suggest recommended actions to mitigate the attack.
Wrapping up
This is the last installment of the Holiday Readiness series before the rush of traffic begins, and I hope these last four months have helped spark conversations and integrations among your aligned Akamai team, as well as your own internal teams. Preparing for the rush of holiday traffic is not easy given the many topics and processes that must fall into place to set you up for a safe holiday season, but Akamai’s solutions can help you get through it successfully.
Next month, be on the lookout for a post-holiday article that will recap data and statistics that we observed across the Akamai platform. As always, wishing you a successful holiday season!


