Open Source Tool for Linux IPC Inspection

Background
Debugging is probably one of the most personal disciplines in software development. Some developers enjoy the ubiquity of gdb, while others prefer working from the comfort of an IDE. Linux users often use strace or ltrace before jumping into a real debugger, and many more of us start inserting printf() into our code when a bug comes up. Habits form fast.
Check out IPCDUMP, New Open-Source Tool for Linux IPC Inspection on GitHub. GET IPCDUMP ON GITHUB.
That’s fine, for the most part. Development is hard enough even in your comfort zone; the distractions of a new tool – even one better-suited to the job at hand – can cause more harm than good. Debugging is particularly troublesome in this respect: it’s probably the most cognitively taxing of all development disciplines. When a system breaks down you have to hold a mental image of every layer of it at once. That’s why it’s so expensive to debug problems that our favorite tools are really not meant for.
Introduction
This brings us to interprocess communication – specifically, IPC on Linux. Debugging is difficult for single-process applications; for multiprocess ones, it’s a nightmare. Typically it is a juggling act of two instances of gdb , each with some byzantine follow-fork-mode configuration which tries to track only the right PIDs. One often needs to look through strace output for all the variations of recv (recvmsg? recvmmsg? recvfrom? Is that all of them?) just to understand who is interacting with whom. To make matters worse, there are lots of different types of IPC on Linux, and they don’t have common code flows, for the most part. A Unix socket and a FIFO both transfer bytes from one end to another, but that’s pretty much all they have in common.
Modern software exacerbates many of these issues: more than before, applications are made up of distinct processes that plug in to one another in a black-box approach. So when something breaks, it can be very, very frustrating to zero in on where that happened. We had issues like these with some of our more complex systems at Guardicore, and we needed a tool to help diagnose them.
That’s why we wrote IPCDUMP. You can find it on GitHub: https://github.com/guardicore/IPCDump
IPCDump – BPF based tool for debugging IPC on linux
IPCDump is a simple tool to operate. Choose the IPC types and process filters you’re interested in, and you’re good to go.

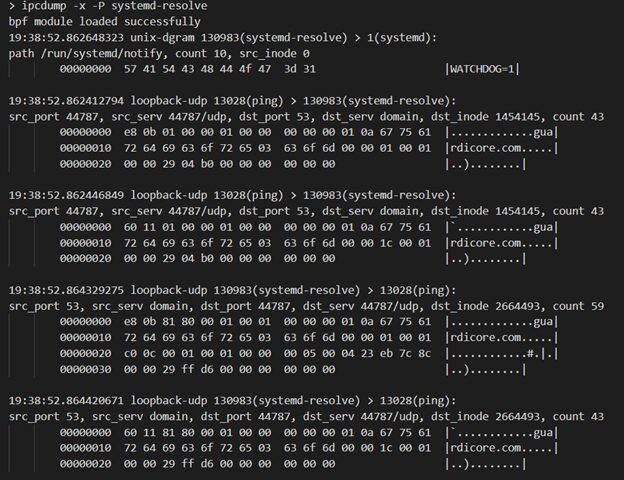
As you can see here, ipcdump is for more than just debugging your own software – it’s also a good way to understand how a program you’re interested in works. Here it’s mostly catching Chrome events (Chrome is a good example of a furious multiprocess application). It’s a lot like how on Windows you’d hack around with procmon to see what process is invoking various system calls – file writes, network operations, module loading, etc, in fact, procmon was one of our main inspirations for ipcdump. For example, if we want to see how domain names are resolved on an Ubuntu machine, we can simply filter by events reaching systemd-resolve:

Pretty neat. systemd-resolved sends keepalives to systemd over the /run/systemd/notify unix socket, and handles domain resolution requests over the local port 53 (in this case, from ping). In the following example, we can see how we are using ipcdump to snoop on unix domain sockets, for example, containerd’s socket.
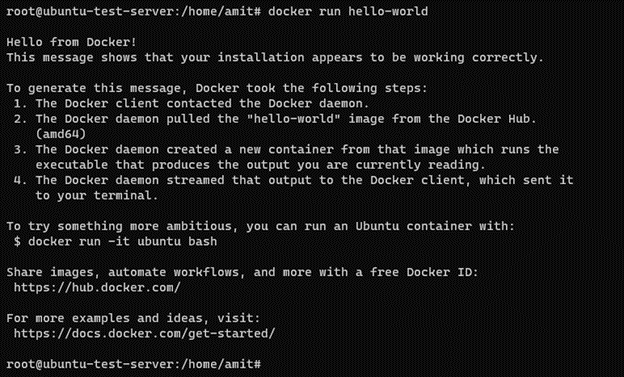
In one terminal, we are executing the following command in order to start docker’s hello-world container:

Docker’s hello world container
As you can see, the container executed successfully. Now, let’s have a look at what we can see with ipcdump, by executing the following command in a separate terminal:
ipcdump -t u -x
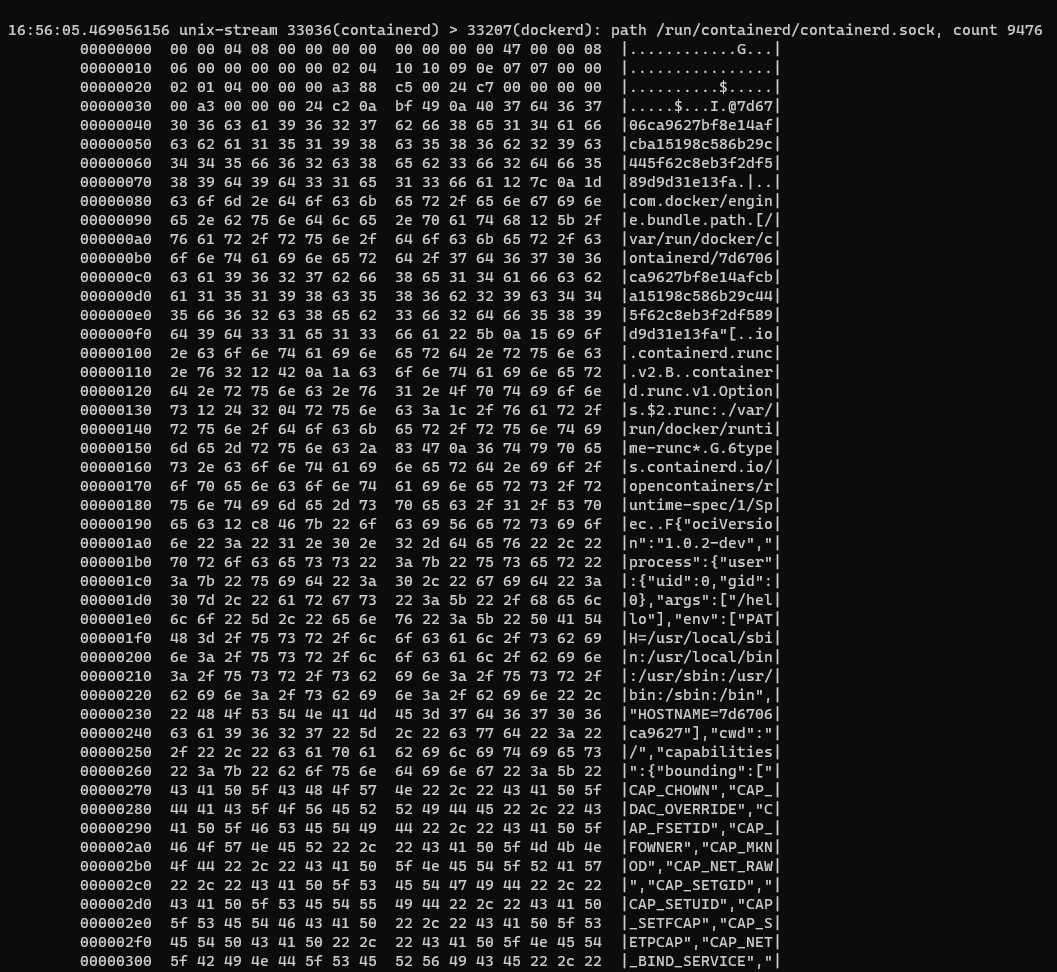
We can see containerd’s ‘conversation’ with dockerd. We can also see the parameters that are passing in between the two processes, we can easily identify what’s in these parameters:

Containerd’s parameters being passed through its unix domain socket, instrumented by ipcdump
Under the hood
Right now, ipcdump supports the instrumentation of the following IPC mechanisms:
- Pipes
- FIFOs
- Loopback TCP and UDP
- Unix streams and datagrams
- Pseudo Terminals (pty)
- Signals
One of the key points for all of these is ipcdump's ability to name the processes at either end of an IPC event. While sniffing over the loopback with tcpdump is a terrific way to understand the traffic you’re seeing between any two processes, it doesn’t actually tell you who those processes are. While you can certainly check port numbers against netstat, short-lived processes will wreak havoc on your ability to map out who really sent out each packet. Short-lived processes are one of the best use-cases for ipcdump in general; a lot of the bookkeeping it does internally is for tracking their creation and destruction.
By default, ipcdump outputs just the metadata of the IPC on the system. You can also use it to dump the actual contents (so you can basically sniff the contents of, say, a Unix socket stream). The output can be either human-friendly or JSON-formatted, so you should be able to process ipcdump output pretty easily.
ipcdump is largely implemented using BPF hooks placed on kprobes and tracepoints. Each of the IPC types it supports has one or more hook points in the kernel that it observes – for example, pty_write() is a good place for pseudoterminal-based IPC, and tcp_rcv_established() is where it probes for loopback-based TCP.
ipcdump collects whatever information it can from these hook points, and then correlates it with whatever other bookkeeping it does to fill out the rest of the details (for example, associating a process name with each PID).
IPCDump – Alpha version
Guardicore Labs released an alpha version of IPCDump. As some of the points we trace in the kernel are internal APIs, the tool requires changes across versions and distributions. You may have to make adjustments and hack around our own hacks. We really appreciate code contributions to this project – everyone stands to gain by improving the ipcdump platform. Check out IPCDump’s README and TODO for more details on how to contribute.
Happy debugging!
Check out IPCDUMP, New Open-Source Tool for Linux IPC Inspection on GitHub. GET IPCDUMP ON GITHUB.


