Timers, Metrics, and Dimensions: What's New for mPulse in 2020

The October 2020 release marks the culmination of a large number of updates to mPulse, Akamai's real user monitoring (RUM) solution:
8 new timers
2 new metrics
5 new dimensions
User interface (UI) improvements
Extra custom timer capabilities
With all of these new changes, you can easily determine and tune the performance of all modern web applications, whether you run a progressive web app (PWA), single-page application (SPA), or HTML5 website.
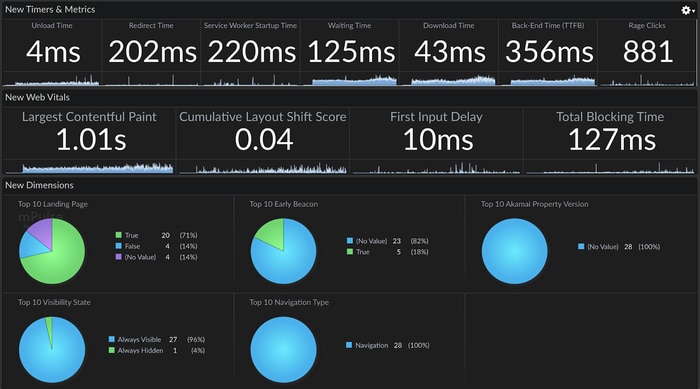
This basic dashboard shows a summary of all the new timers, metrics, and dimensions that we added to mPulse. Read on for more detail.

New timers
Timers are at the core of mPulse and provide a wealth of information about the operational delivery of pages as well as user-perceived speed. With our October 2020 release, we added a slew of new timers, including Google's latest search engine optimization (SEO) recommendation in the page experience update: Core Web Vitals.
The simple diagram below shows how some of the new default timers (outlined) fit into the Navigation Timing API specification and existing mPulse timers that you may be familiar with:

Unload time
This timer measures how long was spent on the previous navigation (same origin only) processing unload handlers. A high unload time will feel like high latency to a user, as the browser delays subsequent navigations while processing these events.
Redirect time
Understand how long was spent in redirects (summed) to get to the correct URL. This metric is good for identifying legacy deep links or server/content delivery network (CDN) configuration issues.
Service worker startup time
If your site is a PWA, you'll have a service worker installed. The additional time taken to initiate the service worker and dispatch the first fetch event is non-zero, so this timer tracks how long it takes.
In addition to this new built-in timer, custom timers can be configured using this timing point. For example, you can now configure a timer to measure from Service Worker Start to Largest Contentful Paint (LCP)!

Waiting time
Measuring the time between when the request for content is sent from the browser and the first byte of content is received provides insight on origin and CDN performance.
Back-end time (TTFB)
Also known as time to first byte (TTFB), back-end time is the full time it takes from the beginning of the navigation to the first byte of content received. This is a good indicator of general delivery performance including Domain Name System (DNS), Transport Layer Security (TLS), and server response. This timer was previously named just Back-End Time.
Largest contentful paint (LCP)
LCP shows you when in the page load the largest visible element (image, video, or text) was painted to the screen. This is a good indication of when the page appears valid to a user. LCP is part of Google's Core Web Vitals.
First input delay
If a user tries to interact with the page (click or tap), First Input Delay (FID) captures how long it takes for the browser to respond to that interaction.
Total blocking time
The total time spent in long tasks between First Contentful Paint and Time to Interactive. A measure of how busy the browser was provides a good proxy for how interactive the page might feel. Total Blocking Time (TBT) is part of the Core Web Vitals for field-collected performance data. As with Google's measurements, we will now only count the task duration after the long task threshold of 50 ms, so three long tasks of 100 ms each will result in a TBT of 150 ms.
New metrics
Metrics in mPulse are traditionally used to track things like conversion rate or revenue, but they can be used to track anything that can be counted or considered as a rate. These new metrics are in addition to session length, bounce rate, and any custom metrics you have defined.
Cumulative layout shift
Cumulative layout shift (CLS) measures how unstable your page content is as it loads. Does the hero image push content down, or does an ad banner frustrate your users? CLS shows how much your page content moves around during the page load, and is part of Google's Core Web Vitals.
Rage clicks
Are users frustrated that links or buttons aren't responding? Rage clicks measure how many times a user tries and fails to interact with an element on the page.
New dimensions
Dimensions in mPulse allow you to filter and group your data to gain more insight. New dimensions sit alongside those that have been around since the beginning such as Country, Device Manufacturer, and Page Groups, as well as any custom dimensions you have defined.
Visibility state
Was the page loaded in a background tab? If so, you might want to exclude the performance metrics from the page view -- browsers can throttle non-visible tabs, which potentially skew results.
Landing page
The first page in the user's session will likely be one of the slowest page views as it may have no cached data and require a full DNS/TCP/TLS connection. This data will give you insight into where to optimize for first-time visitors and landing pages.
Navigation type
Did the user navigate to the page, or refresh it? Were they navigating back through their history to find something? Excluding refreshed pages and back/forward navigations can give a more realistic performance distribution for your pages.
Early beacons
mPulse Early Beacons allow you to capture as much data as is available when mPulse first loads on the page, which is superseded by the full beacon after page load. This dimension allows you to filter to just the Early Beacons that never reached a full beacon.
Akamai property version
This dimension allows you to compare performance and rollout speed between versions of your CDN configuration, automatically collected from Akamai with every page view (if mPulse is enabled via your property configuration).
UI updates

As we added valuable new fields to the data, it became clear that the UI needed updating. While we have a brand-new UI in the works, we made minor updates to the existing one for more convenient performance measurements. For example, timers are now grouped to make it easier to find what you are looking for:
Network performance
Visual performance
Interactivity performance
Page loading performance
CDN performance
Custom timers
Discover new insights
mPulse is now more powerful than ever, enabling product owners, engineers, SEOs, CROs, marketers, and more to find real value in web performance data.
If you're already an Akamai mPulse customer, be sure to check out the new data and insights. If you don't have mPulse yet, now is the time to request a free trial!
There will be more opportunities to engage with us on this and more at Edge Live | Adapt. Sign up to see how customers are leveraging these improvements, engage in technical deep dives, and hear from our executives how Akamai is evolving for the future.


