Metrics That Matter: Continuous Performance Optimization

To attract and retain customers, you must offer an exceptional digital experience. In an increasingly competitive business climate, organizations are fighting to maintain loyalty and keep users engaged online. The cost of switching is low, consumers are transient, and user expectations for how digital experiences should perform have never been higher.
Online performance is an integral part of the user experience (UX) -- an ongoing balancing act between design, functionality, and responsiveness that varies for every organization and industry. Performance optimization starts with a baseline assessment to understand which metrics matter most to your business, so you use the right measurements at the right time.
If you are not continuously optimizing, your website will get slower. According to an internal study by Google, 40% of brands regress on web performance after six months. Operating one of the world's largest edge networks, Akamai can help you deliver fast, personalized online experiences with best practices on how to manage, measure, improve, and maintain your website performance.
Assessing page weight
Useful in the early stages of development, page weight metrics highlight the impact of rich content and scripts on download speed and browser execution time. These metrics are easy to communicate to web designers and developers, and often represent the low-hanging fruit of web optimization. Simple changes can yield significant performance boosts.
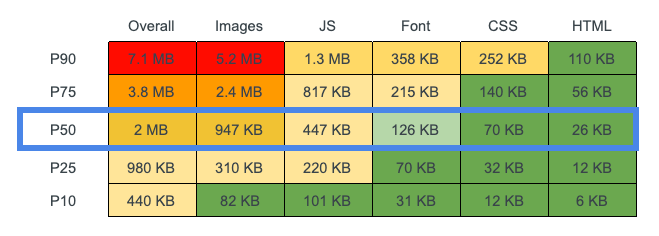
The HTTP Archive Page Weight report, which tracks the size and quantity of many popular web page resources, can help you create a benchmarking guide. The following HTTP Archive table shows page weight percentile overall and by resource type (for example, the P50 percentile is the value below which 50% of the observations may be found) -- if one of these categories is unusually high, it typically means there is an opportunity for optimization:

While these numbers do not tell you much about UX -- for example, two pages with the same number of requests or weight can render differently, depending on the order in which resources are requested -- they can act as a first check on web page performance. LightWallet can keep track of the size and quantity of page resources based on your definition.
Establishing baseline metrics
Using synthetic testing, which replicates user actions under simulated conditions, you can establish a baseline for online performance by measuring response and load times as well as page assets and size. These user-centric performance metrics are typically conducted in a non-production environment to simulate the experience of loading a page.
Synthetic testing simulates online performance for real users based on geographic location, connection, and device. These metrics establish testing standards, and can provide ongoing checks that alert you if performance thresholds are not being met. However, the periodic performance snapshots that synthetic monitoring provides are limited to the scripts, locations, and schedules you develop. You can't measure what you don't know. The only way to truly understand how your site performs for users is through real user monitoring (RUM).
Monitoring real users
To find the right level of performance for your websites and applications to meet your business goals, you need to define key performance indicator (KPI) measurements that assess user satisfaction. The challenge is that measuring the quality of UX is often site- and context-specific. For example, a page might be fast for one user on a 5G network, but slow for another user on a 2G network -- or appear to load quickly, but then respond slowly to user interaction. Synthetic testing measures your application, while RUM provides insight into real user experiences.
When measuring performance, it is essential to be precise and refer to performance in terms of objective criteria that can be quantitatively measured. However, even an objective, quantitative measurement does not apply to all cases. For instance, a server could respond with a minimal page that appears to load immediately, but then defers fetching content and displaying anything on that page until several seconds after the load event fires. While this page technically has a fast load time, that figure does not reflect how a user actually experiences the page loading.
RUM also identifies how first- and third-party scripts affect page load, UX, and business results. According to analysis by thirdpartyweb.today, 57% of JavaScript execution time on the web is spent on third-party code. Data collected across the top 4 million sites shows that advertising accounts for the largest chunk of third-party scripts, followed by hosting platforms and social. RUM helps you understand how these scripts impact user experiences and where you need to prioritize taking action based on your business and customer objectives.

Understanding UX
The W3C Web Performance Working Group is standardizing a set of metrics that more accurately measures how users experience the performance of a web page. There are several types of metrics that are relevant to how users perceive performance:
Perceived load speed indicates how quickly a page can load and render all of its visual elements to the screen
Load responsiveness reveals the rate at which a page can load and execute the required JavaScript, allowing the components to respond quickly to user interaction
Runtime responsiveness shows, after page load, how fast the page can respond to user interaction
The diversity of indicators on UX demonstrates that no single metric is sufficient to capture all the performance characteristics of a page. As a starting point, here are some important measurements to include in your assessments:
First contentful paint (FCP) measures the time from the start of the navigation until the first bit of content is rendered on the screen
Largest contentful paint (LCP) measures the time from when the page starts loading to when the largest text block or image element is rendered on the screen
Time to interactive (TTI) calculates the time from when the page starts loading to when it is fully interactive
These three metrics will provide a general understanding of the performance characteristics for most websites. They are also a good common set of metrics for you to compare performance against your competitors. However, there may be times when a specific website requires additional data to capture the full performance picture. For example, the LCP metric is intended to measure when the main content of a page has finished loading. But there are cases where the largest element is not part of the main content, and LCP does not apply.
Let's look at a case where Akamai helped a customer optimize its digital business by providing visibility into UX to identify measurements that matter.
Customer case study: restaurant chain boosts digital business
A large restaurant chain was looking for more visibility into website performance than its existing content delivery network (CDN) provider delivered. The chain's IT team was tired: tired of working weekends to keep applications up and running, tired of poor web performance adversely impacting the buying experience of loyal customers, and most importantly, tired of guessing at the causes of these issues without the tools to identify and fix them.
To show the restaurant chain the optimization opportunities it was missing, Akamai deployed mPulse RUM on the website. Approximately 10 days later, the front-end data collected was telling. The restaurant chain was missing out on revenue-generating opportunities due to downtime during peak periods, and mPulse data helped pinpoint sources such as:
Cache settings not optimized with the existing CDN's out-of-the-box configuration
Architecture passing traffic through the data center, versus being offloaded by the edge
Back-end jobs creating denial of service (DoS) in the chain's own environment
Suspicious bursts of traffic on the login page from bot attacks
Heavy images causing poor performance and overage fees from the CDN provider

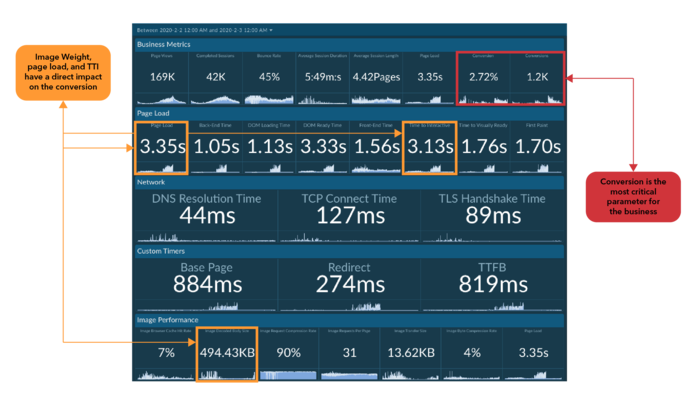
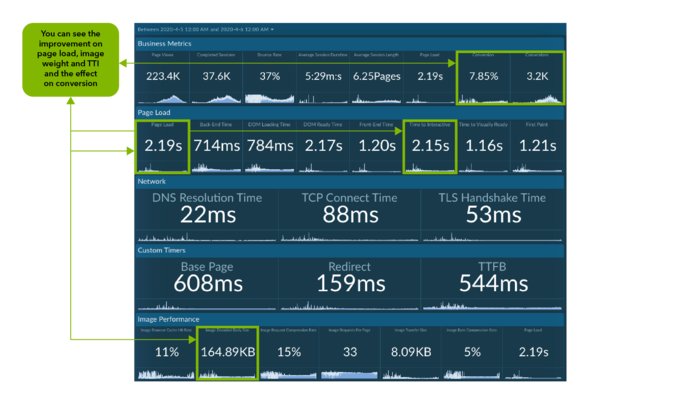
This UX data made a strong case to switch to the Akamai Intelligent Edge Platform. After approximately a week, A/B testing showed that performance on the Akamai platform was better than the previous CDN across every metric. The chain added Akamai Image Manager into the mix to optimize page weight, and conversion numbers reached an all-time high. Page load speeds were noticeably faster, and there was no downtime after switching to Akamai.

Then the COVID-19 crisis came, hitting the restaurant industry hard, and making digital services like online ordering critical for survival. When takeout became the primary business, the chain realized the best sales conversion day in its history -- the Akamai platform helped deliver flawless user experiences despite unprecedented online order volumes. In a two-week period, the restaurant chain's digital business increased from 13% to 26% of total revenue, and the chain attributed the stability of the online business to Akamai.
Never stop optimizing UX
Your ability to assess page weight, establish baseline metrics, and monitor real users is key to understanding UX performance. The specific metrics to use? While there are some proven indicators of UX such as FCP, LCP, and TTI, it always depends on your business and goals.
Using an established framework on the quality of UX, such as Google's HEART framework, is a great way to identify the right metrics for your business. You should assess a mixture of objective measures, such as conversion rate, sales, and registrations, as well as subjective measures such as recommendations and ratings. Along with capturing what happened, it is imperative that you also capture why -- knowing about a dip in user satisfaction over the past 30 days is important, but knowing why it dropped is even more important. RUM can provide you with this insight, as can open-text questions and an ongoing dialogue with users.
Finally, you should be striving for positive business outcomes, not just healthy UX performance metrics. Always look to improve the UX for your websites and applications, but only if the optimizations support your business goals by keeping customers happy and coming back.


