Get EdgeWorkers Error Reports with mPulse

Akamai mPulse and Akamai EdgeWorkers have joined forces to bring you an exciting new capability: mPulse can now seamlessly capture EdgeWorkers errors.
This enhancement gives you invaluable insights into EdgeWorkers status in near real time and allows you to see the impact of EdgeWorkers errors on your end users. In addition, it makes troubleshooting EdgeWorkers errors much faster and easier.
This blog post describes how to set up the configurations on Akamai Control Center to unlock the potential of this feature.
How to use mPulse to capture EdgeWorkers errors
Use the following two (or three) steps to configure mPulse to capture errors on EdgeWorkers.
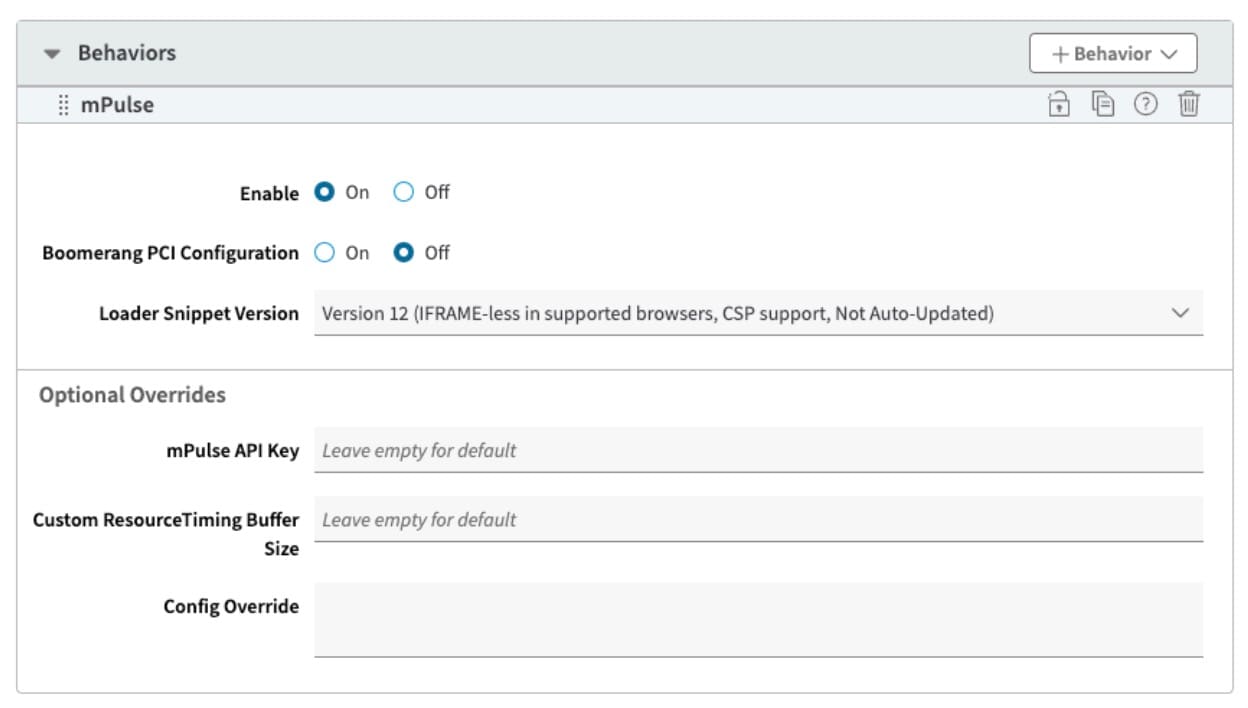
1. To use the feature, mPulse behavior must be enabled (Figure 1).
 Fig. 1: The mPulse Behaviors page
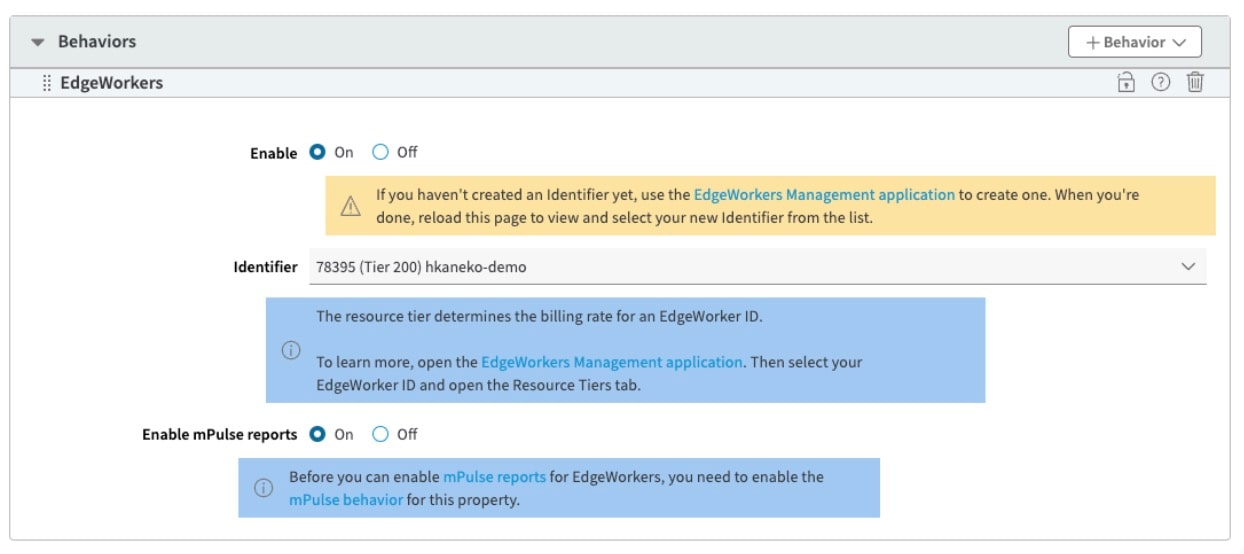
 Fig. 2: The EdgeWorkers Behaviors page
3. Optional) If you want to capture EdgeWorkers errors only (rather than the general web performance data), “PMUSER_MPULSE_SNIPPET” can be disabled (Figure 3). This option will prevent the injection of the mPulse snippet for HTML pages.
 Fig. 3: The Property Variables tab
Brand-new user interface
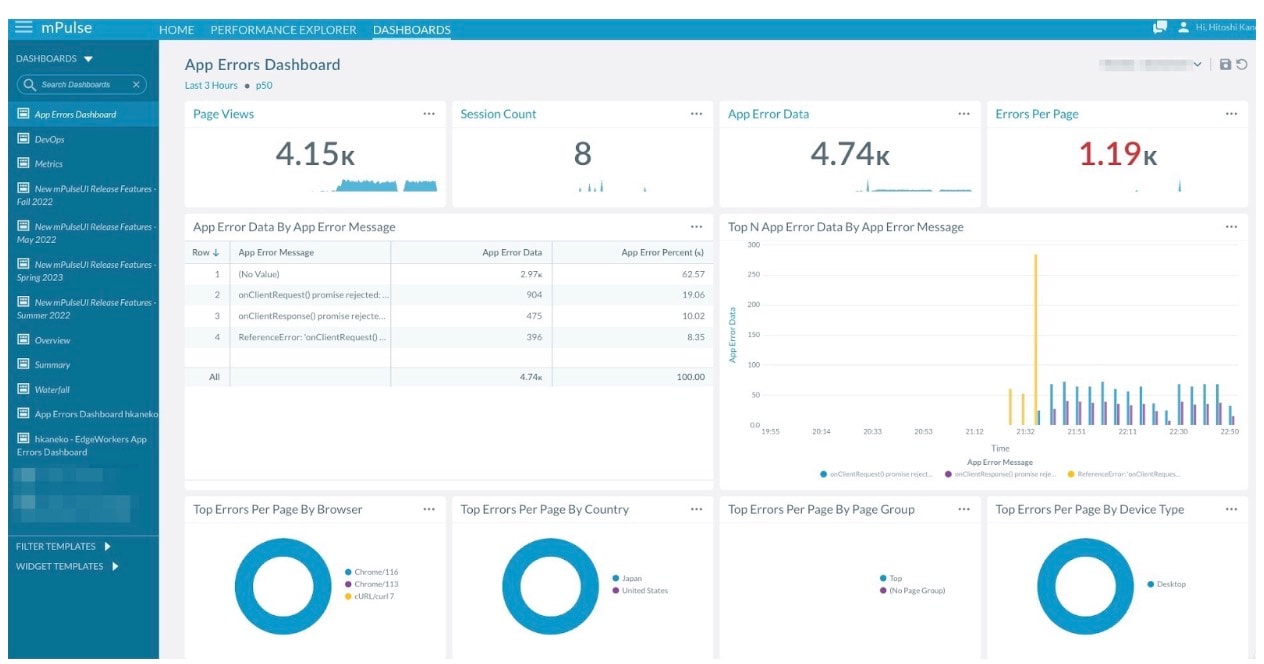
In today’s ever-evolving landscape of web performance monitoring, you must have visibility into the status of your solutions. As a result, mPulse introduced a cutting-edge new user interface that has a built-in dashboard called “App Errors Dashboard” for both mPulse Lite users and mPulse Enterprise users (Figure 4).
 Fig. 4: The App Errors Dashboard in mPulse
Gain valuable information from a custom dashboard
mPulse can display even more valuable information by creating a custom dashboard. The mPulse built-in dimensions that are useful for error reports include:
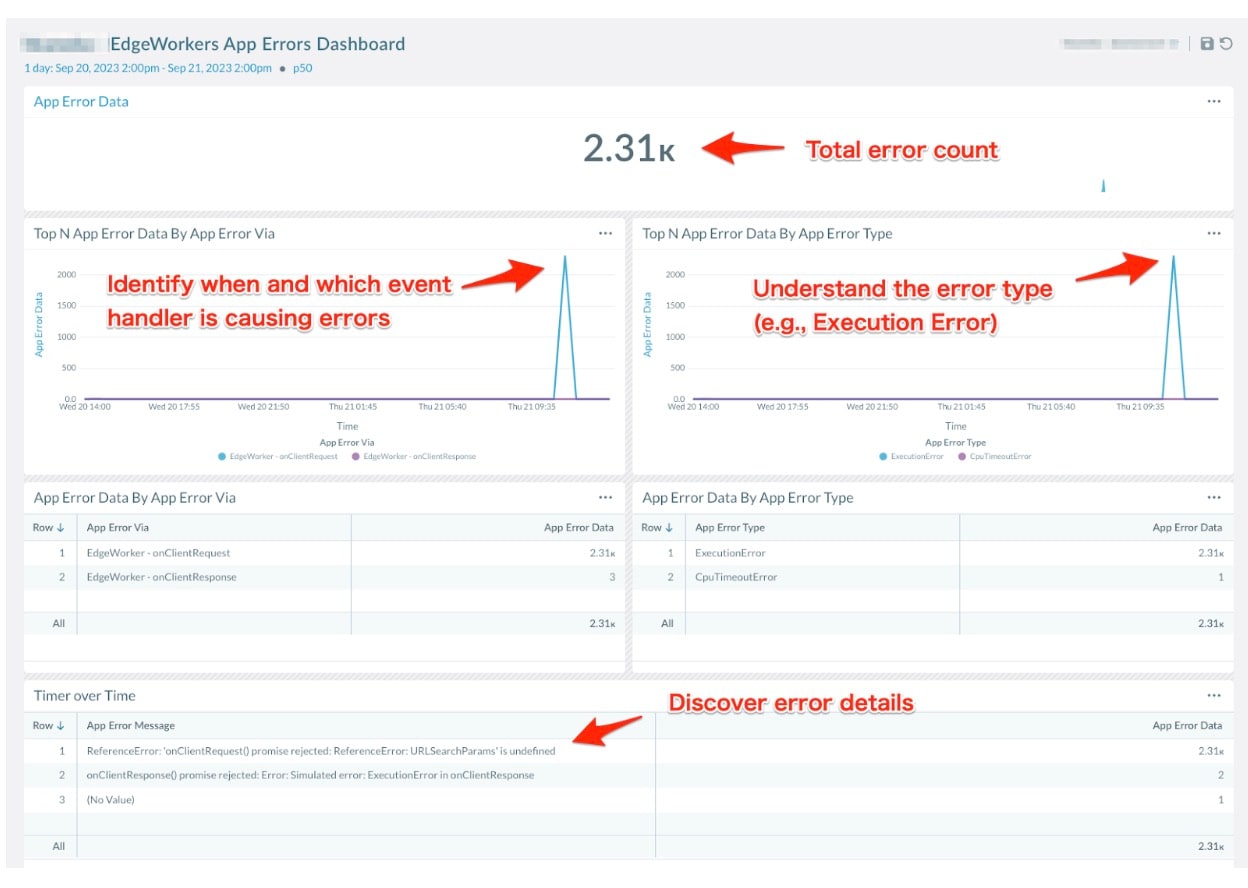
Error Source: This describes which event handler is responsible for generating the EdgeWorker error — for example,“EdgeWorkers - onClientRequest”
App Error Type: This classifies the nature of the error — for example,, “CpuTimeOutError”
App Error Message: This provides specific error details, if they are available — for example “ReferenceError: 'onClientRequest() promise rejected: ReferenceError: URLSearchParams' is undefined”
Troubleshooting
With the use of this data, troubleshooting can proceed as follows: Begin by understanding the error counts, then identify the error in the event handler and its type. The App Errors Dashboard provides insight into the error (Figure 5).
 Fig. 5: The EdgeWorkers App Errors Dashboard
The Beacon Details on the waterfall dashboard is also useful for a detailed analysis of errors after the errors occur. The GENERAL tab displays the path where the error occurs.
 Fig. 6: The GENERAL tab on the Beacon Details page
The ERRORS tab displays the error message and the function name (Figure 7).
 Fig. 7: The ERRORS tab on the Beacon Details page
The raw data includes:
Function name
Line numbers of the JavaScript code
Column number of the JavaScript code
These fields enable customers to identify the cause of the error. In Figure 8, we can identify that the issue occurred at line 29 and column 17 in the 'checkSimulatedErrors' function of main.js.
 Fig. 8: An example of raw data on the Beacon Details page
While reviewing the EdgeWorkers code, we noticed that the code on line 29 utilizes URLSearchParams, but we also discovered that it has not been defined earlier.

Get started
Monitoring EdgeWorkers errors in near real time enables you to understand how your site performs and makes troubleshooting much easier. Start your free trial today.


